Download
1 / 1
10 likes | 116 Vues
Analysis of Surface Inundation Change within Arctic Permafrost Zones using AMSR-E Fw Retrievals . Jennifer D. Watts 1,2,* , J. S. Kimball 1,2 , L. Jones 1,2 , R. Schroeder 3 , and K. C. McDonald 4

E N D
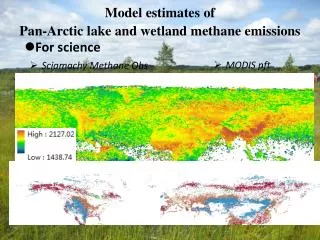
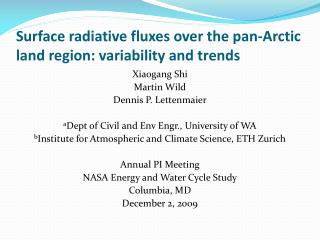
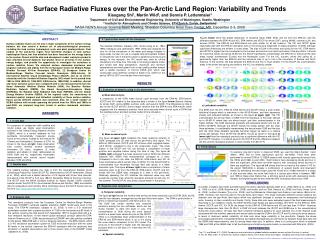
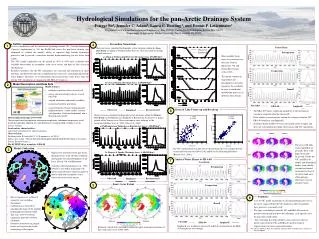
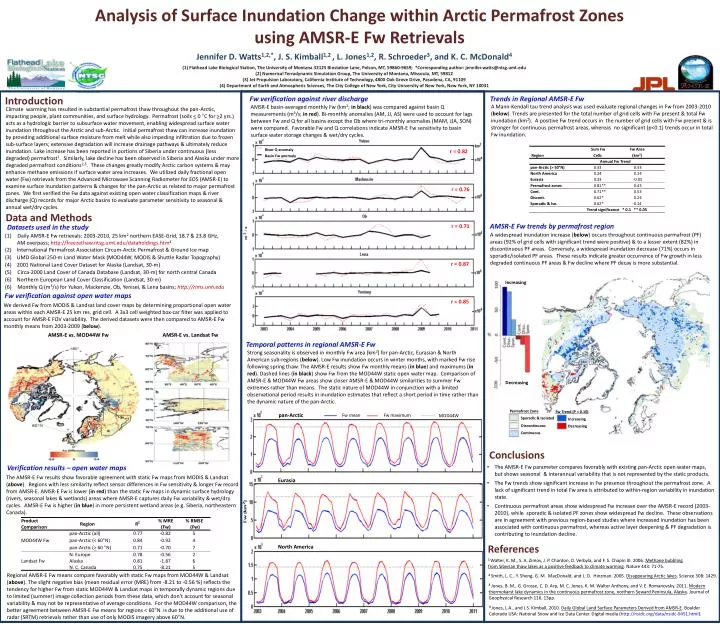
Analysis of Surface Inundation Change within Arctic Permafrost Zones using AMSR-E Fw Retrievals • Jennifer D. Watts1,2,*, J. S. Kimball1,2 , L. Jones1,2, R. Schroeder3, and K. C. McDonald4 • (1) Flathead Lake Biological Station, The University of Montana 32125 Biostation Lane, Polson, MT, 59860-9659; *Corresponding author: jennifer.watts@ntsg.umt.edu • (2) Numerical Terradynamic Simulation Group, The University of Montana, Missoula, MT, 59812 • (3) Jet Propulsion Laboratory, California Institute of Technology, 4800 Oak Grove Drive, Pasadena, CA, 91109 • (4) Department of Earth and Atmospheric Sciences, The City College of New York, City University of New York, New York, NY 10031 Introduction Fw verification against river discharge Trends in Regional AMSR-E Fw A Mann-Kendall tau trend analysis was used evaluate regional changes in Fw from 2003-2010 (below). Trends are presented for the total number of grid cells with Fw present & total Fw inundation (km2). A positive Fw trend occurs in the number of grid cells with Fw present & is stronger for continuous permafrost areas, whereas no significant (p<0.1) trends occur in total Fw inundation. AMSR-E basin-averaged monthly Fw (km2; in black) was compared against basin Q measurements (m3/s; in red). Bi-monthly anomalies (AM, JJ, AS) were used to account for lags between Fw and Q for all basins except the Ob where tri-monthly anomalies (MAM, JJA, SON) were compared. Favorable Fw and Q correlations indicate AMSR-E Fw sensitivity to basin surface water storage changes & wet/dry cycles. Climate warming has resulted in substantial permafrost thaw throughout the pan-Arctic, impacting people, plant communities, and surface hydrology. Permafrost (soils < 0 °C for >2 yrs.) acts as a hydrologic barrier to subsurface water movement, enabling widespread surface water inundation throughout the Arctic and sub-Arctic. Initial permafrost thaw can increase inundation by providing additional surface moisture from melt while also impeding infiltration due to frozen sub-surface layers; extensive degradation will increase drainage pathways & ultimately reduce inundation. Lake increase has been reported in portions of Siberia under continuous (less degraded) permafrost1. Similarly, lake decline has been observed in Siberia and Alaska under more degraded permafrost conditions2,3. These changes greatly modify Arctic carbon systems & may enhance methane emissions if surface water area increases. We utilized daily fractional open water (Fw) retrievals from the Advanced Microwave Scanning Radiometer for EOS (AMSR-E) to examine surface inundation patterns & changes for the pan-Arctic as related to major permafrost zones. We first verified the Fw data against existing open water classification maps & river discharge (Q) records for major Arctic basins to evaluate parameter sensitivity to seasonal & annual wet/dry cycles. Increasing River Q anomaly Basin Fw anomaly Data and Methods AMSR-E Fw trends by permafrost region Datasets used in the study A widespread inundation increase (below) occurs throughout continuous permafrost (PF) areas (92% of grid cells with significant trend were positive) & to a lesser extent (82%) in discontinuous PF areas. Conversely, a widespread inundation decrease (71%) occurs in sporadic/isolated PF areas. These results indicate greater occurrence of Fw growth in less degraded continuous PF areas & Fw decline where PF decay is more substantial. • Daily AMSR-E Fw retrievals: 2003-2010, 25 km2 northern EASE-Grid, 18.7 & 23.8 GHz, • AM overpass; http://freezethaw.ntsg.umt.edu/dataholdings.htm4 • (2) International Permafrost Association Circum-Arctic Permafrost & Ground Ice map • (3) UMD Global 250-m Land Water Mask (MOD44W; MODIS & Shuttle Radar Topography) • (4) 2001 National Land Cover Dataset for Alaska (Landsat, 30-m) • Circa-2000 Land Cover of Canada Database (Landsat, 30-m) for north central Canada • (6) Northern European Land Cover Classification (Landsat, 30-m) • Monthly Q (m3/s) for Yukon, Mackenzie, Ob, Yenisei, & Lena basins; http://rims.unh.edu Decreasing Fw verification against open water maps Sporadic & Isolated Increasing We derived Fw from MODIS & Landsat land cover maps by determining proportional open water areas within each AMSR-E 25 km res. grid cell. A 3x3 cell weighted box-car filter was applied to account for AMSR-E FOV variability. The derived datasets were then compared to AMSR-E Fw monthly means from 2003-2009 (below). Permafrost Zone Fw Trend (P < 0.10) Discontinuous Decreasing Continuous Temporal patterns in regional AMSR-E Fw Strong seasonality is observed in monthly Fw area (km2) for pan-Arctic, Eurasian & North American sub-regions (below). Low Fw inundation occurs in winter months, with marked Fw rise following spring thaw. The AMSR-E results show Fw monthly means (in blue) and maximums (in red). Dashed lines (in black) show Fw from the MOD44W static open water map. Comparison of AMSR-E & MOD44W Fw areas show closer AMSR-E & MOD44W similarities to summer Fw extremes rather than means. The static nature of MOD44W in conjunction with a limited observational period results in inundation estimates that reflect a short period in time rather than the dynamic nature of the pan-Arctic. r = 0.82 AMSR-E vs. MOD44W Fw AMSR-E vs. Landsat Fw r = 0.76 r = 0.71 r = 0.87 r = 0.85 Conclusions pan-Arctic Verification results – open water maps • The AMSR-E Fw parameter compares favorably with existing pan-Arctic open water maps, but shows seasonal & interannual variability that is not represented by the static products. • The Fw trends show significant increase in Fw presence throughout the permafrost zone. A lack of significant trend in total Fw area is attributed to within-region variability in inundation state. • Continuous permafrost areas show widespread Fw increase over the AMSR-E record (2003-2010), while sporadic & isolated PF zones show widespread Fw decline. These observations are in agreement with previous region-based studies where increased inundation has been associated with continuous permafrost, whereas active layer deepening & PF degradation is contributing to inundation decline. The AMSR-E Fw results show favorable agreement with static Fw maps from MODIS & Landsat (above). Regions with less similarity reflect sensor differences in Fw sensitivity & longer Fw record from AMSR-E. AMSR-E Fw is lower (in red) than the static Fw maps in dynamic surface hydrology (rivers, seasonal lakes & wetlands) areas where AMSR-E captures daily Fw variability & wet/dry cycles. AMSR-E Fw is higher (in blue) in more persistent wetland areas (e.g. Siberia, northeastern Canada). Fw mean Fw maximum MOD44W Eurasia References 1 Walter, K. M., S. A. Zimov, J. P. Chanton, D. Verbyla, and F. S. Chapin III. 2006. Methane bubbling from Siberian thaw lakes as a positive feedback to climate warming. Nature 443: 71-75. Regional AMSR-E Fw means compare favorably with static Fw maps from MOD44W & Landsat (above). The slight negative bias (mean residual error (MRE) from -8.21 to -0.56 %) reflects the tendency for higher Fw from static MOD44W & Landsat maps in temporally dynamic regions due to limited (summer) image collection periods from these data, which don’t account for seasonal variability & may not be representative of average conditions. For the MOD44W comparison, the better agreement between AMSR-E Fw means for regions < 60°N is due to the additional use of radar (SRTM) retrievals rather than use of only MODIS imagery above 60°N. 2 Smith, L. C., Y. Sheng, G. M. MacDonald, and L. D. Hinzman. 2005. Disappearing Arctic lakes. Science 308: 1429. North America 3 Jones, B. M., G. Grosse, C. D. Arp, M. C. Jones, K. M. Walter Anthony, and V. E. Romanovsky. 2011. Modern thermokarst lake dynamics in the continuous permafrost zone, northern Seward Peninsula, Alaska. Journal of Geophysical Research 116. 13pp. 4 Jones, L.A., and J.S. Kimball, 2010. Daily Global Land Surface Parameters Derived from AMSR-E. Boulder Colorado USA: National Snow and Ice Data Center. Digital media (http://nsidc.org/data/nsidc-0451.html).