Download
1 / 1
10 likes | 128 Vues
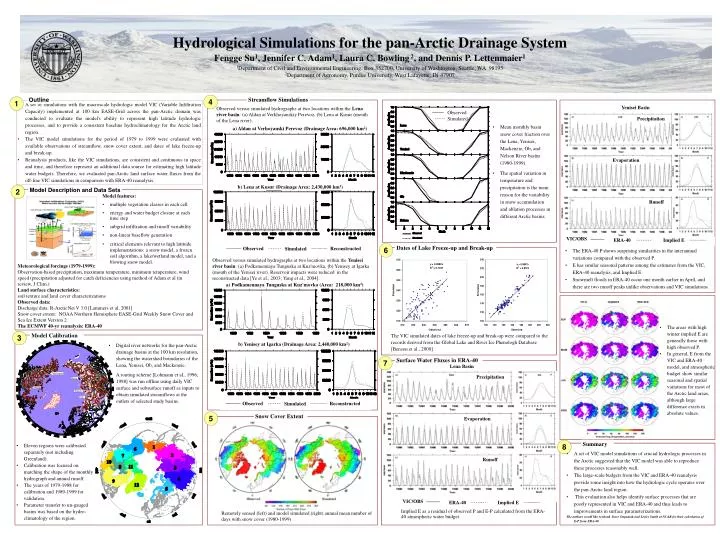
Observed. Simulated. Observed. Observed. Reconstructed. Reconstructed. Simulated. Simulated. Mackenzie. Lena. Nelson. Yenisei. Ob. VIC/OBS. VIC/OBS. ERA-40. ERA-40. Implied E. Implied E. Hydrological Simulations for the pan-Arctic Drainage System

E N D
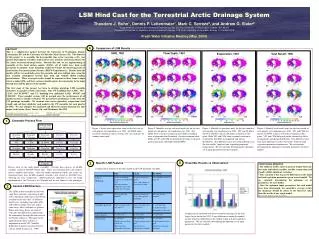
Observed Simulated Observed Observed Reconstructed Reconstructed Simulated Simulated Mackenzie Lena Nelson Yenisei Ob VIC/OBS VIC/OBS ERA-40 ERA-40 Implied E Implied E Hydrological Simulations for the pan-Arctic Drainage System Fengge Su1, Jennifer C. Adam1, Laura C. Bowling2, and Dennis P. Lettenmaier1 1Department of Civil and Environmental Engineering, Box 352700, University of Washington, Seattle, WA 98195 2Department of Agronomy, Purdue University, West Lafayette, IN 47907 4 Streamflow Simulations Outline 1 • A set of simulations with the macroscale hydrologic model VIC (Variable Infiltration Capacity) implemented at 100 km EASE-Grid across the pan-Arctic domain was conducted to evaluate the model's ability to represent high latitude hydrologic processes, and to provide a consistent baseline hydroclimatology for the Arctic land region. . • The VIC model simulations for the period of 1979 to 1999 were evaluated with available observations of streamflow, snow cover extent, and dates of lake freeze-up and break-up. • Reanalysis products, like the VIC simulations, are consistent and continuous in space and time, and therefore represent an additional data source for estimating high latitude water budgets. Therefore, we evaluated pan-Arctic land surface water fluxes from the off-line VIC simulations in comparison with ERA-40 reanalysis. Yenisei Basin Observed versus simulated hydrographs at two locations within the Lena river basin: (a) Aldan at Verkhoyanskiy Perevoz, (b) Lena at Kusur (mouth of the Lena river). Precipitation • Mean monthly basin snow cover fraction over the Lena, Yenisei, Mackenzie, Ob, and Nelson River basins (1980-1999). • The spatial variation in temperature and precipitation is the main reason for the variability in snow accumulation and ablation processes in different Arctic basins. a) Aldan at Verhoyanski Perevoz (Drainage Area: 696,000 km2) Evaporation b) Lena at Kusur (Drainage Area: 2,430,000 km2) 2 Model Description and Data Sets • Model features: • multiple vegetation classes in each cell • energy and water budget closure at each time step • subgrid infiltration and runoff variability • non-linear baseflow generation • critical elements relevant to high latitude implementations: a snow model, a frozen soil algorithm, a lake/wetland model, and a blowing snow model. Runoff 6 Dates of Lake Freeze-up and Break-up • The ERA-40 P shows surprising similarities in the interannual variations compared with the observed P. • E has similar seasonal patterns among the estimates from the VIC, ERA-40 reanalysis, and Implied E. • Snowmelt floods in ERA-40 occur one month earlier in April, and there are two runoff peaks unlike observations and VIC simulations. Observedversus simulated hydrographs at two locations within the Yenisei river basin: (a) PodkamennayaTunguska at Kuz'movka, (b) Yenisey at Igarka (mouth of the Yenisei river). Reservoir impacts were reduced in the reconstructed data [Ye et al., 2003; Yang et al., 2004]. Meteorological forcings (1979-1999): Observation-based precipitation, maximum temperature, minimum temperature, wind speed (precipitation adjusted for catch deficiencies using method of Adam et al (in review, J Clim.) Land surface characteristics: soil texture and land cover characterizations Observed data: Discharge data: R-ArcticNet V 3.0 [Lammers et al, 2001] Snow cover extent: NOAA Northern Hemisphere EASE-Grid Weekly Snow Cover and Sea Ice Extent Version 2 The ECMWF 40-yr reanalysis: ERA-40 a) Podkamennaya Tunguska at Kuz'movka (Area: 218,000 km2) • The areas with high winter implied E are generally those with high observed P. • In general, E from the VIC and ERA-40 model, and atmospheric budget show similar seasonal and spatial variations for most of the Arctic land areas, although large difference exists in absolute values. 3 Model Calibration The VIC simulated dates of lake freeze-up and break-up were compared to the records derived from the Global Lake and River Ice Phenologh Database [Benson et al., 2000]. b) Yenisey at Igarka (Drainage Area: 2,440,000 km2) • Digital river networks for the pan-Arctic drainage basins at the 100 km resolution, showing the watershed boundaries of the Lena, Yenisei, Ob, and Mackenzie. • A routing scheme [Lohmann et al., 1996; 1998] was run offline using daily VIC surface and subsurface runoff as inputs to obtain simulated streamflows at the outlets of selected study basins. Surface Water Fluxes in ERA-40 7 Lena Basin Precipitation 5 Snow Cover Extent Evaporation Summary 8 • Eleven regions were calibrated separately (not including Greenland). • Calibration was focused on matching the shape of the monthly hydrograph and annual runoff. • The years of 1979-1988 for calibration and 1989-1999 for validation. • Parameter transfer to un-gauged basins was based on the hydro-climatology of the region. • A set of VIC model simulations of crucial hydrologic processes in the Arctic suggested that the VIC model was able to reproduce these processes reasonably well. • The large-scale budgets from the VIC and ERA-40 reanalysis provide some insight into how the hydrologic cycle operates over the pan-Arctic land region. • This evaluation also helps identify surface processes that are poorly represented in VIC and ERA-40 and thus leads to improvements in surface parameterizations. • The authors would like to thank Dave Stepaniak and Lesley Smith at NCAR for their calculation of E-P from ERA-40 Runoff Implied E as a residual of observed P and E-P calculated from the ERA-40 atmospheric water budget. Remotely sensed (left) and model simulated (right) annual mean number of days with snow cover (1980-1999)