Download
1 / 11
110 likes | 240 Vues
Coda attenuation analysis of Zagreb area, Croatia. Iva Dasović , Marijan Herak and Davorka Herak Andrija Mohorovičić Geophysical Institute Department of Geophysics, Faculty of Science University of Zagreb. Supported by. The Foundation of the Croatian Academy of Sciences and Arts.

E N D
Coda attenuation analysis of Zagreb area, Croatia Iva Dasović, Marijan Herak and Davorka Herak Andrija Mohorovičić Geophysical Institute Department of Geophysics, Faculty of Science University of Zagreb Supported by The Foundation of the Croatian Academy of Sciences and Arts
Seismicity of Croatia – Croatian Earthquake Catalogue: 373 BC - 2010
Stations and earthquakes PTJ: 2004-2010, 70 earthquakes ZAG: 2001-2010, 71 earthquakes Δ < 120 km, ML ≥ 2.0, h < 30 km
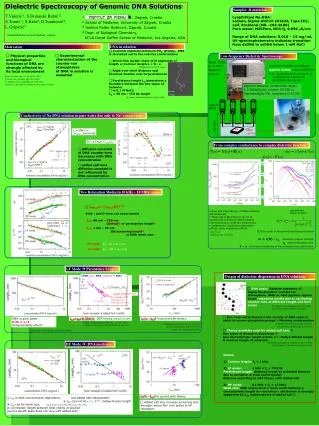
The single backscattering model • The coda-Q method (Aki and Chouet, 1975) Envelope Attenuation Source function Propagation term, m=2 for body waves Linear regression Linear regression Q0= Qc(f = f0= 1Hz)
Procedure tWL = time window length (30 s) tL = lapse time→ shifted windows tS = S-wave travel time Band-pass filters [fl,fu] and central frequencies f Dasović et al. (accepted for publication in Stud. Geophys. Geod.)
Results: Qc (tL, f) Smoothed values of Qc (tL, f) in contour-graph
Q0 and n depend on tL 40 80 120 160 200 240 h (km) 40 80 120 160 200 240 h (km) h = ½ vst
Q0 and n in coastal Croatia (the External Dinarides) Dasović et al. (accepted for publication in Stud. Geophys. Geod.)
Q0 and n depend on tL – different referent frequency f0? Dasović et al. (accepted for publication in Stud. Geophys. Geod.)
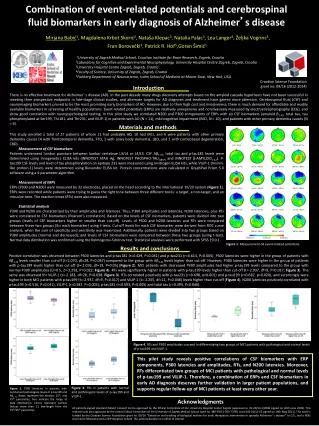
lnPGA475vs. Q0→ 11 stations: coastal region + Zagreb area ρ =correlation coefficient p = statistically significant confidence level PGA475 = peak ground acceleration for the return period of 475 yr at the station site R = radius equivalent to tL for average vs = 3.8 km/s
Conclusions • Q0 and n indicate highly heterogeneous medium • Coda-Q is lapse time dependent • A marked change of Q0 and n at about 100 km depth (upper mantle) • Different choice of f0 might “eliminate” lapse time dependence of Qc • Very convincing correlation between Q0 and PGA475 (seismicity)