Download
1 / 40
400 likes | 699 Vues
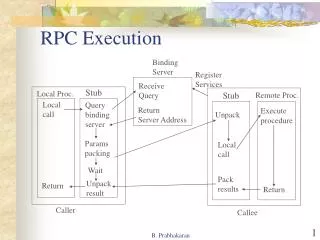
Alternative Execution. November 2006 Stavros Siokos Ph.D. +44 207 986 0752 stavros.siokos@citigroup.com. The New World of Equity Trading and Modelling. Alpha generation models. Risk Analysis & Control models. Quantitative Models. Quantitative Strategy – Equity Research – (Mid 1980s –Now)

E N D
Alternative Execution November 2006 Stavros Siokos Ph.D. +44 207 986 0752 stavros.siokos@citigroup.com The New World of Equity Trading and Modelling
Quantitative Models • Quantitative Strategy – Equity Research – (Mid 1980s –Now) • A series of models have been developed from Quant Strategy teams focusing into: • Stock Screening Models • Pairs Trading • Industry/Sector Rotation models • Alpha generation strategies • Portfolio Trading Strategies – Equities (Late 1990’s – now) • These teams are focusing on customizable risk analysis, portfolio construction and pre/post trade analytics. Products include: • Optimization solutions • Marginal Contribution to Risk • Long/ Short portfolio portfolio construction and risk analysis • VAR • Most applications provided can be used as engines that host customer created inputs (e.g. covariance matrices) • Solutions can be customized for intra day problems as well as specified types of models.
Historical Overview (I) • 1960- late 1980s A lot of pioneering research on: • fundamental analysis, • macroeconomic models • risk models (Markowitz-CAPM-GARCH) The foundations of Financial Engineering were developed • Early 1990’s • Advances in computational technology and databases helped improve the models and run accurate back tests. Non-linear models were hugely explored.
Historical Overview (II) • Late 1990’s • Innovative fundamental models (CART) • Advanced risk models. • More improvements in technology. • Who cares….. • Last 4 years • Commissions are down. • Alternative Investments and hedge funds are the theme of the day. • New ways are needed to make money. • Real time models and short term analysis on the rise. • Hybrids/Structured products
Elements of Good Models • Quantitative Accuracy • Real life assumptions • Uncertainty considered • Accurate back tests • Perception of Reliability • Sophisticated Investors test against internal data • The industry needs convincing and reliable models • No time and expense for theoretical models • Analytical Simplicity • Simple Models • Transparent • Multi-assets • Derivatives
So what is the industry focusing on? State of the art risk management tools Alpha generation and Statistical arbitrage models “Smart Servers” Good technical infrastructure
What is an Algorithmic trading “Smart” Server? “A Smart Server is an intelligent trading destination that auto-executes trades according to a pre-defined trading strategy”
Direct Market Access (DMA) No broker intervention Lowest Commission Direct Strategy Access (DSA) No broker intervention Low Commission but above DMA Portfolio Trading Limited Broker Service Low commission Cash Trading Full broker Service Highest Commission Equity Trading Solutions Execution Not Outsourced Execution Fully Outsourced
Distribution of Citigroup European Flow EXECUTION Manual Execution 51% ORDER ROUTE TO MARKET CASH 56% Risk 15% Algorithms 38% Agency 40% VWAP 15% MOC 7% Agency 28% IS 2% PT 33% AE 44% Risk 5% PART 16% DSA 6% CUSTOM 4% DMA 5%
Alternative Execution Products Long Established • Portfolio Trading • Agency • Risk (Capital Commitment) • Strategies • Global Portfolio Trading Strategies (GPTS) • Best Execution Consulting Services (BECS) More Recently Developed • Algorithmic Trading • Internal • Direct Server Access (DSA) • Direct Market Access
Where can Algorithmic Trading potentially lead? Head of Complex Adaptive Systems Research Group at HP, “Rise of the Robots: Increasing market efficiencies By Eliminating Human traders” Dr. Dave Cliff “Full Control and ownership of the decision process”. Accountability, Discretion, Responsibility.
Ideal Toolkit • Customizable trading strategies based on price and volume patterns • Market participation (e.g. VWAP) • % Follow • Portfolio based implementation shortfall • Optimal Trade scheduling • Pairs trading • Smart Reloading (Smart Iceberg) • Auction Management • P&L stop loss • Sensitivity limits • Optionality (“Greeks”) • State of the art optimization (Min-Max) • Customizable functions • Volume • Price • Aggression
What does a Smart Server utilize for incremental Performance • Bid-Ask Spread • Volatility risk • Volume Depth • Temporary Abnormalities in the market
Bid / Offer Spreads Bid / offer spreads vary widely by country .....
Bid / Offer Spreads ... and by size Source: CGM - Spreads in Basis Points
The Market • 4 top asset managers that use Algorithms in Europe • Average of $50bn each in 2003, 41% Smart • Top 4 Brokers on Algorithms: • In excess of $880bn in 2003 in Europe
Algorithmic Trading Historic Milestones ’90’s -> Rapid Portfolio Trading growth ’90’s -> Electronic Exchange connectivity simplified Requirement to handle multiple orders efficiently. ’97 -> Brokers build internal algorithmic teams, all PT flows through group. ’00 + -> Execution tools are provided for Asset Management firms ’00 + -> Increased awareness, centralised dealing desks looking for suite of tools ’03 -> Brokers aggressively market algorithmic products ’05 -> Brokers might consider opening up internal tools to asset managers (CSFB,Lehman, ML, UBS, Citigroup)
Lower Commission Cost Anonymity Speed (DMA) Performance (DSA) Legislation (e.g. MiFid) Development of centralised dealing desks Increased number of Hedge Funds Sophistication of Order Management Systems (OMS) What is driving the use of DMA & DSA?
Why DMA & DSA did not pick as quickly in Europe as in the US? • The use of DMA & DSA demands an increased level of resources from the buy desk (more traders and better technology) • Limited experience and comfort from the buy side trader • OMS deployment and utilisation has not been as quick as in the US • Price of risk trading • In some houses Portfolio Managers are still responsible for execution with no time to focus on DMA and DSA
What is the client base for DMA/DSA? • Traditional Asset Management institutions • Hedge Funds • Private Bank and Equity Firms • Other Brokers Beginning 2006 Institutions 35% Hedge Funds 65% September 2006 Institutions 55% Hedge Funds 45%
DMA and DSA offering Both DSA and DMA • We have been slow to enter this space but we are now offering a solid and competitive platform in Europe that supports a whole range of order types with several innovative characteristics. • Designed and tested rigorously to ensurestability. Client feedback suggests the offering is excellent in terms of speed, performance and latency. • We are continuously expanding the number of vendor partners DSA • We provide fully transparent systems and models. “Glass box” offering rather than “black box” solution. • Designed to deliverflexibilityto the user through configurable constraints • Combined with state-of-the-art Pre and Post Trade systems (BECS) • We use our traders to educate our clients
Is Algorithmic Trading and DSA new? • Algorithmic Trading is not new. Initially these systems were developed internally by brokers in an effort to improve the performance and lower the volatility on the quality of execution . • DSA is a more recent offering. Over the last 3-4 years algorithms and OMS advanced enough that the sell side started to offer direct electronic access to their trading engines.
What are the advantages of DSA? • Helps deliver better execution by improving performance and reducing volatility • Enhance the buy-side’s control over its orders • Empower traders to focus on difficult trades that require manual intervention • Maintain anonymity
What makes algorithmic trading “smart”? The design of trading algorithms presents numerous mathematical and financial engineering challenges. These fall into two main categories • Subdivision of the “parent” order into smaller “child” orders (trade scheduling) • Trading tactics deployed to achieve the best price for their children
What is the common DSA offering? Almost 1600 in 17 markets. Global Access now possible • Models • VWAP • Participate • Market on Close (MOC) • TWAP/Smart Slice • Implementation Shortfall (IS) • Current Functionality • Start, Stop, Duration • Min, Max,% Volume • Price Limit Benchmark • Sector, Index and Price Limit Tolerances • Trading Style
Volumes in 2006 for European Algorithms Monthly Notional ($billion) Jan Feb Mar Apr May June Jul Aug
Performance of European Algorithms Performance (basis points)
Challenges… • New Strategies and Products that differentiate as from the competition • A significant proportion of DMA and Algorithmic Trading business at the competition is generated as an add on to Equity Swap and Prime Brokerage business – our historic lack of capacity in these areas means we have not competed for this type of business • Some clients expect a bundled front end offering such as Passport (MS), Redi(GS) – we support multi-broker platforms where all our clients can access our products
Portfolio Construction Risk Analysis Trading Strategies Optimization Beta Management Portable Alpha Index Changes Structured Products Pre and Post Trade Analytics (BECS) Other Products
AVERAGE ORDER: 120,000 shares in $20Bn company, representing 1¼ days' volume. Large Cap Small & Mid Cap A50,000 shares in a $450 mil company, representing 3¼ days' volume. Commission 0.22% Commission 0.12% Impact 0.33% Impact 0.20% Delay 1.72% Delay 0.53% Missed Trades 2.22% Missed Trades 0.16% $ $ $ $ The Plexus “Iceberg” of Transaction Costs
Forecast Trading Impact Buy 50,000 VOD.L – Expected Impact 19bps Source: BECS
Optimal Execution Buy 50,000 VOD.L Source: BECS
Conclusions • Quant models and electronic ways of trading are here to stay • Portfolio Trading, Algorithmic Trading and Direct Market Access are the way ahead • Established business are converging towards the same way of execution • These products are not here to replace traders or “cannibalise” regular cash business but rather to compliment them and support the