Download

1 / 46
460 likes | 536 Vues
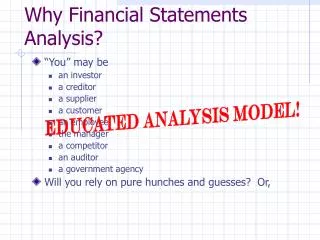
TOPIC 9: FINANCIAL STATEMENT ANALYSIS. Introduction. Interpretation is when users evaluate financial information to make judgements It is the key to any in-depth understanding of an organisation’s performance.

E N D
Introduction • Interpretation is when users evaluate financial information to make judgements • It is the key to any in-depth understanding of an organisation’s performance. • Basically, the users evaluate an organisation’s performance using the information from INCOME STATEMENT and BALANCE SHEET. • The value of the analysis is depends on the value of the financial statements.
Techniques (types) of analysis:… 1. Horizontal Analysis • Comparing key figures in financial statement • It evaluates a series of financial statement over a period of time. 2. Vertical Analysis • It evaluates financial statement by expressing each item in a financial statement as a percent of the base amount (key figure) • Key-figure (such as sales in P&L and total assets on BS) are set to 100% • Other items are then expressed as percentage of 100 3. Trend analysis • Similar to horizontal analysis, except that the first set of account in the series is given a base of 100 4. Ratio Analysis • It expresses the relationship among selected items of financial statement data.
Horizontal Analysis What is horizontal analysis? It’s an analysis of the percentage increases and decreases of related items in comparative financial statements.
14-7 HOME DEPOTComparative Balance Sheets (in Millions)February 3, 2002 and January 28, 2001 Increase (Decrease) Feb. 3, 2002 Jan. 28, 2001 Amount Percent Assets Current assets $10,361 $ 7,777 $2,584 33.2% Property and equipment, net 15,375 13,068 2,307 17.7 Other assets 658 540 118 21.9 Total assets $26,394 $21,385 $5,009 23.4 Liabilities Current liabilities $ 6,501 $ 4,385 $2,116 48.3 Long-term debt, excluding current installment 1,250 1,545 (295) (19.1) Other long-term liabilities 372 256 116 45.3 Deferred income taxes 189 195 (6) (3.1) Total long-term liabilities $ 1,811$ 1,996$ (185) (9.3) Total liabilities $ 8,312$ 6,381$1,931 30.3 The stockholders’ equity section is not displayed.
Horizontal Analysis: Difference $2,584 Base year $7,777 = 33.2% 14-8 HOME DEPOTComparative Balance Sheets (in Millions)February 3, 2002 and January 28, 2001 Increase (Decrease) Feb. 3, 2002 Jan. 28, 2001 Amount Percent Assets Current assets $10,361 $ 7,777 $2,584 33.2% Property and equipment, net 15,375 13,068 2,307 17.7 Other assets 658 540 118 21.9 Total assets $26,394 $21,385 $5,009 23.4 Liabilities Current liabilities $ 6,501 $ 4,385 $2,116 48.3 Long-term debt, excluding current installment 1,250 1,545 (295) (19.1) Other long-term liabilities 372 256 116 45.3 Deferred income taxes 189 195 (6) (3.1) Total long-term liabilities $ 1,811$ 1,996$ (185) (9.3) Total liabilities $ 8,312$ 6,381$1,931 30.3 33.2%
Horizontal Analysis: Difference $2,307 Base year $13,068 = 17.7% 14-9 HOME DEPOTComparative Balance Sheets (in Millions)February 3, 2002 and January 28, 2001 Condensed Increase (Decrease) Feb. 3, 2002 Jan. 28, 2001 Amount Percent Assets Current assets $10,361 $ 7,777 $2,584 33.2% Property and equipment, net 15,375 13,068 2,307 17.7 Other assets 658 540 118 21.9 Total assets $26,394 $21,385 $5,009 23.4 Liabilities Current liabilities $ 6,501 $ 4,385 $2,116 48.3 Long-term debt, excluding current installment 1,250 1,545 (295) (19.1) Other long-term liabilities 372 256 116 45.3 Deferred income taxes 189 195 (6) (3.1) Total long-term liabilities $ 1,811$ 1,996$ (185) (9.3) Total liabilities $ 8,312$ 6,381$1,931 30.3 33.2% 33.2% 17.7
Horizontal Analysis: Difference $7,815 Base year $45,738 = 17.1% 14-11 HOME DEPOT INC. Income Statement (in millions)For Periods Ended February 3, 2002 and January 28, 2001 Increase (Decrease) 2002 2001 Amount Percent 17.1% Sales (net) $53,553 $45,738 $7,815 Cost of merchandise sold 37,406 32,057 5,349 Gross profit $16,147$13,681$2,466 Selling and store operating exp. 10,280 8,655 1,625 General and administrative exp. 935 835 100 Total operating expenses $11,215$ 9,490$1,725 Income from operations $ 4,932 $ 4,191 $ 741 Other income and expenses: Interest and investment inc. 53 47 6 Interest expense (28) (21) (7) Income before income tax $ 4,957 $ 4,217 $ 740 Income taxes 1,913 1,636 277 Net income $ 3,044 $ 2,581 $ 463
Horizontal Analysis: Difference $5,349 Base year $32,057 = 16.7 14-12 HOME DEPOT INC. Income Statement (in millions)For Periods Ended February 3, 2002 and January 28, 2001 Increase (Decrease) 2002 2001 Amount Percent 17.1% Sales (net) $53,553 $45,738 $7,815 Cost of merchandise sold 37,406 32,057 5,349 Gross profit $16,147$13,681$2,466 Selling and store operating exp. 10,280 8,655 1,625 General and administrative exp. 935 835 100 Total operating expenses $11,215$ 9,490$1,725 Income from operations $ 4,932 $ 4,191 $ 741 Other income and expenses: Interest and investment inc. 53 47 6 Interest expense (28) (21) (7) Income before income tax $ 4,957 $ 4,217 $ 740 Income taxes 1,913 1,636 277 Net income $ 3,044 $ 2,581 $ 463 16.7
17.1% 16.7 14-13 HOME DEPOT INC. Income Statement (in millions)For Periods Ended February 3, 2002 and January 28, 2001 Increase (Decrease) 2002 2001 Amount Percent Sales (net) $53,553 $45,738 $7,815 Cost of merchandise sold 37,406 32,057 5,349 Gross profit $16,147$13,681$2,466 Selling and store operating exp. 10,280 8,655 1,625 General and administrative exp. 935 835 100 Total operating expenses $11,215$ 9,490$1,725 Income from operations $ 4,932 $ 4,191 $ 741 Other income and expenses: Interest and investment inc. 53 47 6 Interest expense (28) (21) (7) Income before income tax $ 4,957 $ 4,217 $ 740 Income taxes 1,913 1,636 277 Net income $ 3,044 $ 2,581 $ 463 18.0 18.8 12.0 18.2 17.7 12.8 33.3 17.5 16.9 17.9
Vertical Analysis A percentage analysis can be used to show the relationship of each component to a total within a single statement.
Vertical Analysis The total, or 100% item, on the balance sheet is “total assets.” The total, or 100% item, on the income statement is “total sales.”
14-18 14-18 HOME DEPOTComparative Balance Sheets (in Millions)February 3, 2002 and January 28, 2001 Condensed Feb. 3, 2002 Jan. 28, 2001 Amount Percent Amount Percent Assets Current assets $10,361 $ 7,777 Property and equipment, net 15,375 13,068 Other assets 58 540 Total assets $26,394 $21,385 Liabilities Current liabilities $ 6,501 $ 4,385 Long-term liabilities 1,811 1,996 Total liabilities $ 8,312$ 6,381 Stockholders’ Equity Common stock/paid-in capital $ 5,529 $ 4,926 RE & accumulated comp. loss 12,553 10,078 Total stockholders’ equity $18,082$15,004 Total liabilities and SE $26,394 $21,385 100.0% Total assets is 100.0%
Vertical Analysis: Current assets $10,361 Total assets $26,394 = 39.3% 14-19 HOME DEPOTComparative Balance Sheets (in Millions)February 3, 2002 and January 28, 2001 Condensed Feb. 3, 2002 Jan. 28, 2001 Amount Percent Amount Percent Assets Current assets $10,361 $ 7,777 Property and equipment, net 15,375 13,068 Other assets 58 540 Total assets $26,394 $21,385 Liabilities Current liabilities $ 6,501 $ 4,385 Long-term liabilities 1,811 1,996 Total liabilities $ 8,312$ 6,381 Stockholders’ Equity Common stock/paid-in capital $ 5,529 $ 4,926 RE & accumulated comp. loss 12,553 10,078 Total stockholders’ equity $18,082$15,004 Total liabilities and SE $26,394 $21,385 39.3% 100.0%
14-20 HOME DEPOTComparative Balance Sheets (in Millions)February 3, 2002 and January 28, 2001 Condensed Feb. 3, 2002 Jan. 28, 2001 Amount Percent Amount Percent Assets Current assets $10,361 $ 7,777 Property and equipment, net 15,375 13,068 Other assets 58 540 Total assets $26,394 $21,385 Liabilities Current liabilities $ 6,501 $ 4,385 Long-term liabilities 1,811 1,996 Total liabilities $ 8,312$ 6,381 Stockholders’ Equity Common stock/paid-in capital $ 5,529 $ 4,926 RE & accumulated comp. loss 12,553 10,078 Total stockholders’ equity $18,082$15,004 Total liabilities and SE $26,394 $21,385 39.3% 58.2 2.5 100.0% 24.6% 6.9 31.5% 20.9% 47.6 68.5% 100.0%
39.3% 58.2 2.5 100.0% 24.6% 6.9 31.5% 20.9% 47.6 68.5% 100.0% 14-21 HOME DEPOTComparative Balance Sheets (in Millions)February 3, 2002 and January 28, 2001 Condensed Feb. 3, 2002 Jan. 28, 2001 Amount Percent Amount Percent Assets Current assets $10,361 $ 7,777 Property and equipment, net 15,375 13,068 Other assets 58 540 Total assets $26,394 $21,385 Liabilities Current liabilities $ 6,501 $ 4,385 Long-term liabilities 1,811 1,996 Total liabilities $ 8,312$ 6,381 Stockholders’ Equity Common stock/paid-in capital $ 5,529 $ 4,926 RE & accumulated comp. loss 12,553 10,078 Total stockholders’ equity $18,082$15,004 Total liabilities and SE $26,394 $21,385 100.0% Total assets is 100.0%
39.3% 58.2 2.5 100.0% 24.6% 6.9 31.5% 20.9% 47.6 68.5% 100.0% Vertical Analysis: Current assets $7,777 Total assets $21,385 = 36.4% 14-22 HOME DEPOTComparative Balance Sheets (in Millions)February 3, 2002 and January 28, 2001 Condensed Feb. 3, 2002 Jan. 28, 2001 Amount Percent Amount Percent Assets Current assets $10,361 $ 7,777 Property and equipment, net 15,375 13,068 Other assets 58 540 Total assets $26,394 $21,385 Liabilities Current liabilities $ 6,501 $ 4,385 Long-term liabilities 1,811 1,996 Total liabilities $ 8,312$ 6,381 Stockholders’ Equity Common stock/paid-in capital $ 5,529 $ 4,926 RE & accumulated comp. loss 12,553 10,078 Total stockholders’ equity $18,082$15,004 Total liabilities and SE $26,394 $21,385 36.4% 100.0%
39.3% 58.2 2.5 100.0% 24.6% 6.9 31.5% 20.9% 47.6 68.5% 100.0% 14-23 HOME DEPOTComparative Balance Sheets (in Millions)February 3, 2002 and January 28, 2001 Condensed Feb. 3, 2002 Jan. 28, 2001 Amount Percent Amount Percent Assets Current assets $10,361 $ 7,777 Property and equipment, net 15,375 13,068 Other assets 58 540 Total assets $26,394 $21,385 Liabilities Current liabilities $ 6,501 $ 4,385 Long-term liabilities 1,811 1,996 Total liabilities $ 8,312$ 6,381 Stockholders’ Equity Common stock/paid-in capital $ 5,529 $ 4,926 RE & accumulated comp. loss 12,553 10,078 Total stockholders’ equity $18,082$15,004 Total liabilities and SE $26,394 $21,385 36.4% 61.1 2.5 100.0% 20.5% 9.3 29.8% 23.0% 47.1 70.2% 100.0%
14-24 HOME DEPOT INC. Income Statement (in millions)For Periods Ended February 3, 2002 and January 28, 2001 2002 2001 Amount Percent Amount Percent Sales (net) $53,553 100.0% $45,738 100.0% Cost of merchandise sold 37,406 32,057 Gross profit $16,147$13,681 Selling and store operating exp. 10,280 8,655 General and administrative exp. 935 835 Total operating expenses $11,215$ 9,490 Income from operations $ 4,932 $ 4,191 Other income and expenses: Interest and investment inc. 53 47 Interest expense (28) (21) Income before income tax $ 4,957 $ 4,217 Income taxes 1,913 1,636 Net income $ 3,044 $ 2,581 Net sales is 100.0% Net sales is 100.0%
2001 Vertical Analysis: Cost of Merchandise Sold $32,057 Net Sales $45,738 = 70.1% 14-25 HOME DEPOT INC. Income Statement (in millions)For Periods Ended February 3, 2002 and January 28, 2001 2002 2001 Amount Percent Amount Percent Sales (net) $53,553 100.0% $45,738 100.0% Cost of merchandise sold 37,406 32,057 Gross profit $16,147$13,681 Selling and store operating exp. 10,280 8,655 General and administrative exp. 935 835 Total operating expenses $11,215$ 9,490 Income from operations $ 4,932 $ 4,191 Other income and expenses: Interest and investment inc. 53 47 Interest expense (28) (21) Income before income tax $ 4,957 $ 4,217 Income taxes 1,913 1,636 Net income $ 3,044 $ 2,581 70.1
2002 Vertical Analysis: Cost of Merchandise Sold $37,406 Net Sales $53,553 = 69.9% 14-26 HOME DEPOT INC. Income Statement (in millions)For Periods Ended February 3, 2002 and January 28, 2001 2002 2001 Amount Percent Amount Percent Sales (net) $53,553 100.0% $45,738 100.0% Cost of merchandise sold 37,406 32,057 Gross profit $16,147$13,681 Selling and store operating exp. 10,280 8,655 General and administrative exp. 935 835 Total operating expenses $11,215$ 9,490 Income from operations $ 4,932 $ 4,191 Other income and expenses: Interest and investment inc. 53 47 Interest expense (28) (21) Income before income tax $ 4,957 $ 4,217 Income taxes 1,913 1,636 Net income $ 3,044 $ 2,581 69.9 70.1
14-28 HOME DEPOT INC. Income Statement (in millions)For Periods Ended February 3, 2002 and January 28, 2001 2002 2001 Amount Percent Amount Percent Sales (net) $53,553 100.0% $45,738 100.0% Cost of merchandise sold 37,406 32,057 Gross profit $16,147$13,681 Selling and store operating exp. 10,280 8,655 General and administrative exp. 935 835 Total operating expenses $11,215$ 9,490 Income from operations $ 4,932 $ 4,191 Other income and expenses: Interest and investment inc. 53 47 Interest expense (28) (21) Income before income tax $ 4,957 $ 4,217 Income taxes 1,913 1,636 Net income $ 3,044 $ 2,581 69.9 30.1% 19.2% 1.7 20.9% 9.2% 0.1 (0.0) 9.3% 3.6 5.7% 70.1 29.9% 18.9% 1.8 20.7% 9.2% 0.1 (0.1) 9.2% 3.6 5.6%
Types of ratio analysis • Profitability Ratio • Efficiency/activity/asset management Ratio • Liquidity Ratio • Solvency Ratio • Cash flow • Investment
1. Profitability 1. Return on capital employed 2. Gross profit ratio 3. Net profit ratio 2. Liquidity 1. Current ratio 2. Quick ratio 3. Efficiency 1. Debtors turnover 2. Debtors collection period 3. Stock turnover ratio 4. Asset turnover ratio 4. Solvency/financial leverage management ratio 1. Debt to Equity ratio 2.Debt ratio
Continue……….. 5. Cash Flow 1. Cash flow ratio 6. Investment 1. Dividend yield 2. Dividend cover 3. Earnings per share 4. Price/earnings ratio 5. Interest cover
Importance of Ratios • Quick and easy snapshot of an organisation’s achievements • Aid for comparisons • Ratio provide benchmark to compare one company with another (inter-firm comparison) or to compare the same company over time (intra-firm comparison). • Takes account of size
PROFITABILITY RATIO • It measure the income or operating effectiveness of an organisation for a given period of time. • A low value of this ratio will affect the company ‘s ability to obtain debt, equity financing and the ability to grow or expand. i Return on capital employed • measures effective use of capital • It measures the profitability from the shareholder view point. • It shows how many ringgit of the net income were earned for each ringgit invested by the owner. = Profit or earning after tax x 100% Average capital employed
Continue… ii. Gross Profit Margin • It measures the percentage of one ringgit of sales that results in gross income. =Sales – Cost of Goods Sold x 100% Sales = Gross Profit x 100% Sales iii. Net Profit Margin It measures the percentage of one ringgit of sales that results in net income. = Profit or earning after tax x 100% Sales
LIQUIDITY RATIO • It measure the short term ability of the organisation to pay debt and to meet unexpected need for cash. i. Current Ratio • To measure the ability of current asset that the company have to pay back the short term debt. = Current Asset Current Liability
Continue… • ii. Quick Ratio • It measures the company’s immediate short term liquidity. • Current Asset – Stock – Prepayment • Current Liability • This ratio indicates whether current liabilities could be paid without having to sell the inventory • This ratio is useful for companies who cannot convert inventory into cash quickly if necessary.
Cont…. • This ratio indicates whether the business has enough short-term assets to cover its short-term liabilities. • A ratio above 1 indicates that working capital is positive (Current assets exceed current liabilities) • A ratio below 1 indicates that working capital is negative. • Many large companies regularly operate with current ratio closer to 1 and 2 • Generally the higher the ratio, the greater the financial stability and the lower the risk for both creditors and owners. • However, the ratio should not be too high because that may indicate that the business is not reinvesting in long-term assets to maintain future productivity. • High current ratio can actually indicate problems if inventories are getting larger than they should be or collections of receivables are slowing down.
EFFICIENCY RATIO • Debtors turnover • Measures how many times it takes customers to pay Credit sales Average debtors
EFFICIENCY RATIO 1. Debtors collection period • Measures how long it takes customers to pay = Average debtors x 365 days OR365 days Credit salesdebtors turnover • This ratio indicates how many days it takes, on average to collect a day’s sale revenue. • The quicker a business collects and bank the money, the better it is to the company • Large numbers of days is a negative signal, raising questions about the company’s policies of granting credit such as; • Unstricted credit policies • Longer credit limit • Collection attempts is not very strength
Efficiency Ratio 3. Stock turnover ratio • measures how quickly stock moves through business • This ratio means that the average length of time that the stocks are held before being sold. = Cost of goods sold Average stock It can also be calculated in days = Average stock x 365 day or365 days Cost of sales stock turnover
Efficiency Ratio • Asset turnover ratio • compares sales to total assets employed • Measure how efficient the assets in generating sales = Sales x 100% Average total assets
SOLVENCY/FINANCIAL LEVERAGE MANAGEMENT RATIO 1. Debt to Equity ratio = Total liabilities Total Equity 2. Debt ratio Also call debt to assets ratio = Total liabilities Total Asset
SOLVENCY/FINANCIAL LEVERAGE MANAGEMENT RATIO • This is to measure the ability of the company to survive over a long period of time • The ability to pay interest as it come due/mature
Income Statement for the year ended 31 Dec 2001 Sales 200 Less: Cost of sales (100) Gross profits 100 Less expenses General 40 Interest 10(50) Profit before tax 50 Less: Taxation (15) Profits after tax 35 Less: Dividends(15) Retained profits 20
1. Profitability Ratios a, Return on Capital Employed Profit after tax = 35 = 16.3% Average capital employed 215 b, Gross Profit Ratio Gross profit= 100 = 50% Sales 200 c, Net Profit Ratio Net profit after taxation = 35 = 17.5% sales 200
2. Liquidity Ratios a. Current Ratio Current assets = 120 = 2 Current liabilities 60 b. Quick Ratio Current assets - stock = 120-60 = 1 Current liabilities 60
3. Efficiency Ratios Debtors Collection Period Average debtors x 365 = 40 x 365 = 73 days Credit sales 200
c. Stock Turnover Cost of sales = 100 = 1.66 times Average stock 60 d. Asset Turnover Ratio Sales x 100% = 200 x 100% Average total assets 395 = 51%
4. Financing ratio a) Debt to equity ratio Total liabilities = 180 = 0.837 Total equity 215 b) Debt ratio Total liabilities = 180 = 0.456 Total assets 395
Limitations of the Accounting Information • Estimates The financial statement contains numerous estimates. Ex. Provision for doubtful debt, depreciation and contingent loss. • Cost The traditional financial statements are based on historical cost, it is not adjusted for price-level change. Ex. Inflation affects the sales growth. • Alternative Accounting Method A comparison may be misleading as different companies use different accounting method. Ex. FIFO and LIFO. • Diversification of firms This diversification of activities of companies limit the usefulness of financial analysis. (no specific industry).
CONCLUSION • Ratio analysis is a good way to overview an organisation’s activities • Ratio analysis must be compared with past result or industry norms, not in isolation • Things to be taken into account in using ratio analysis: • size of the organisation • Method used in accounting treatment • Same industry • Same country