Download
1 / 42
460 likes | 981 Vues
Preference Analysis and Competitive Positioning. BA 6324: Fundamentals of Marketing Professor Dillon Lecture Notes: Set #8. Preference Analysis and Competitive Positioning. 1. Overview/Basic Framework 2. Competitive Positioning Studies 3. Product Maps 4. Mapping Illustration

E N D
Preference Analysis and Competitive Positioning BA 6324: Fundamentals of Marketing Professor Dillon Lecture Notes: Set #8
Preference Analysis and Competitive Positioning 1. Overview/Basic Framework 2. Competitive Positioning Studies 3. Product Maps 4. Mapping Illustration 5. Understanding Preferences and Relation to Market Share 6. Product Preference Maps 7. Strategic Market Studies 8. Practice Problems 2
E N V I R O N M E N T Attitudes Intentions Behavior Preference Analysis and Competitive Positioning 1. Overview/Basic Framework Attitude – Behavior Paradigm ⇒ Evaluation of the expected utility that a product/service (brand) contains Reflection of Preference
Preference Analysis and Competitive Positioning 1.1 Positioning: What is it? Positioning determines the nature of the dialogue between the product/brand and the customer/consumer. Positioning is the art of meaning management • Positioning represents the meaning that a specific group of consumers attach to a product/brand. • Positioning involves the on-going game of identifying, creating, translating, transforming and configuring meaning. Positioning reflects the promise that a product makes to a customer • Positioning must identify the appropriate frame of reference—the relevant set of target goals that will be satisfied by using the product/brand and the groups of customers for whom these goals are relevant. • Positioning informs the articulation of the goals that a customer will achieve by using the product/brand and explains why it is superior to other means of accomplishing this goal. Positioning presents the customer with the reasons to believe • Positioning articulates salient points and differences and provides evidence for supporting claims. • Positioning guides the choice of targets and explains how customer relevant points of pain will be alleviated.
Preference Analysis and Competitive Positioning 1.2 What is Positioning Research? Positioning research involves capturing the meaning that a customer attaches to a new product/brand offering, identifying the relationship of those meanings to the meanings attached to current and competitive products/brands, testing initial positioning ideas, and refining the positioning based on customer feedback. Examples of Business Questions Addressed by Positioning Research • What is the current positioning of our product/brand with the target audience? • How distinct is our product/brand from our competitors within the same category? • Which competitive products/brands are currently viewed as viable alternatives to our product/brand? • How should the new generation of our product/brand be positioned against the current version? • What “white space” exists in the needs of our target audience and how should we leverage that white space in our positioning? • What are the pain points of our target audience and could we position our product/brand to alleviate these pain points? • How do we support the promises that we make about our products/brands?
Preference Analysis and Competitive Positioning 1.3 What Should Be The Primary Objectives of Positioning Research? The goal of positioning is to create and occupy a unique space within the customers’ head. Thus, positioning research should seek to: • Understand the (perceptual) location of the product/brand offering in the existing perceptual product space which will managers to • Determine whether the meaning that a customer attaches to the product/brand offering is consistent with the intended brand meaning, • Determine whether different customer types respond differently to the positioning of the product/brand offering. It is quite possible that even customers from the same audience (e.g., ITDMs) are not all alike in the meaning that they attach to the product/brand. • Identifying customer heterogeneity in perceptions allows managers to go into the message development phase with a more acute understanding of the potential need to develop customer targeted messages. These two broad objectives informs three important questions that positioning research attempts to answer: (a) Is the meaning derived from a positioning statement what was intended? (b) How heterogeneous are customers in their interpretation of the positioning statements? (c) Which positioning strategies should we go forward with?
Preference Analysis and Competitive Positioning 2. Competitive Positioning Studies > Product-positioning studies provide “pictures” or maps of the competitive structure or other relationships among a predetermined set of products or brands. Such maps are based upon judgments by a sample of respondents who are familiar with the product category under study and who, presumably represent how “the market” perceives the predetermined set of products or bands. Product maps provide management with a consumer perspective on competition in the market place.
Preference Analysis and Competitive Positioning > When used early in the marketing planning process, product maps can influence the alternative courses of action that are considered in later stages of the product’s life and research cycles. Product maps have also been used to (1) develop and evaluate strategic plans, (2) track market changes, (3) Investigate the relationship between the firm’s actions and their market consequences, and (4) position or reposition a brand to appeal to specific consumers.
Pretzels Peanuts Raw vegetables Fritos Nachos Granola bar Apple Potato chips Corn curls Popcorn Beef jerky Soda crackers Pizza Candy bar Cookies Raisins Nutritional value Pie Bagels Banana Donut Cake Cheese Ice cream Yogurt Crunchiness Soda pop Fruit juice Preference Analysis and Competitive Positioning 3. Product Maps HIGH Space that represents the perceived relationships among a set of brands; the spatial distance between any two brands represents the degree to which they are perceived as being similar in terms of relevant attributes or preferences. HIGH LOW LOW > Product maps consist of two essential elements: 1. A set of axes that reflect the dimensions on which the brands are judged. Typically, these dimensions represent product features or attributes that are judged as important to the consumer. 2. A set of coordinates (scores) that can be used to position each brand in the perceptual product space; in essence, the score gives a brand’s position on the evaluative dimensions represented by the axes.
Preference Analysis and Competitive Positioning 3.1Logic Underlying Perceptual Maps - Consumer (like other humans) are simplifiers. Faced with complex decisions or large numbers of cues they will attempt to simplify the decision. - To simplify the purchase decision consumers evaluate the set under consideration on a relatively small number of (evaluative) dimensions. - These evaluative dimensions capture the essence of brand/service similarities and differences and reveal competitive relationships in a succinct and meaningful way. - Evaluative dimensions are broad, general and somewhat abstract relating to end benefits desired: - Innovator - Reliable - Leading Edge - Anxiety - Forward Thinking - Good Value - For each dimension there are specific attributes/features that reflect what the dimension relates to. -Anxiety I feel apprehensive about using the system The system is somewhat intimidating to me I don’t use the system for fear of making a mistake - Forward Thinking Focused on hot new technologies This is ahead of the information curve Is visionary 8
long- no effect no side suitable strength speed lasting stomach effects for child strength 1.0 speed .9 1.0 long-lasting .8 .9 1.0 no effect on stomach .1 .2 .1 1.0 no side effects .2 .1 .2 .8 1.0 suitable for children .1 .1 .1 .9 .9 1.0 Conclusions? Preference Analysis and Competitive Positioning “Leap of Faith” - Consider the following correlation matrix 9
Preference Analysis and Competitive Positioning Another Example 6 brands Celica Prelude Fiero Pulsar Integra Scirroco 14 Attributes Young Powerful Sporty Fun Aerodynamic Manly Aggressive Futuristic Value Quality Prestige Technologically Advanced Dependable Handling
Preference Analysis and Competitive Positioning Propose a factor structure Attribute Correlations 11
Respondent n 3 2 1 Preference Analysis and Competitive Positioning 3.2 Developing the Map 3.2.1 Derived Similarities - Data Cube CompetitorsAttributes PC Week Provides state of the art technology information. InfoWorld Good balance between software and hardware. Information Week Information is accurate. Information is reliable. Provides information that solves my problems. Dow Competitor #1 Competitor #2 Competitor #3 1 2 3 4 5 6 7 8 12 Attrib
10a. First please review the list of long distance telephonecompanies across the page and indicate which companies you are familiar with. 10b. Next for each long distance telephone company you are familiar with, indicate which statements you fell definitely describe that long distance telephone company. (Check All That Apply For EACH Company) 10a Are you familiar with these long distance companies? 10b(Check All That You Feel Definitely Describe Each Company You've Heard Of) 01. Most innovative company 01 01 01 02. Has one flat rate any time of day 02 02 02 03. Superior sound quality 03 03 03 04. The long distance company I prefer 04 04 04 05. Most dependable company 05 05 05 06. Reputation of company 06 06 06 07. Has competitive prices 07 07 07 08. Billing that is accurate 08 08 08 09. Worth what paid for 09 09 09 10. Easy to understand bills 10 10 10 11. Excellent customer service 11 11 11 12. Pricing that's easy to understand 12 12 12 13. Ability to use calling card from any phone 13 13 13 14. Best fit for the way I live 14 14 14 15. Easy calling card access 15 15 15 16. Would trust them to offer reliable services outside of the telephone business 16 16 16 17. Billing that is current 17 17 17 18. Offers savings plans that fit my needs 18 18 18 Preference Analysis and Competitive Positioning Derived Similarities Example 1 Yes 2 No 1 Yes 2 No 1 Yes 2 No
Preference Analysis and Competitive Positioning 3.2.2 Direct Similarities - Comparative Scales Please consider the following movies in terms of their similarity. - Henry V - A Fish Called Wanda - Nuns on the Run - The Little Mermaid - Field of Dreams - Teenage Mutant Ninja Turtles You will be given a set of 15 cards (WHY 15) listing two movies. Please rank order the set of cards in terms of the movies listed. In other words, the first card would contain those two movies you feel are most similar.
Number of Individuals 176 Number of Objects 6 Ideal Object is 0 Number of Attributes 14 Date Input is Means Object Codes: 1 2 3 4 5 6 Preference Analysis and Competitive Positioning 4. Mapping Illustration Auto Imagery Illustration
Preference Analysis and Competitive Positioning Auto Imagery Illustration Group/Object Labels Incidence (Size) A Celica 176 B Fiero 176 C Integra 176 D Prelude 176 E Pulsar 176 F Scirroco 176
Preference Analysis and Competitive Positioning Auto Imagery Illustration Attribute Labels 1. technological 8. handling 2. futuristic 9. quality 3. young 10. aerodynamic 4. value 11. manly 5. aggressive 12. powerful 6. fun 13. sporty 7. prestige 14. dependable
Preference Analysis and Competitive Positioning Auto Imagery Illustration Attribute by Brand Table (Mean Scores) Celica Fiero Integra Prelude Pulsar Scirroco 18
Preference Analysis and Competitive Positioning Auto Imagery Illustration (Euclidean) Brand by Brand Distance Matrix Celica Fiero Integra Prelude Pulsar Scirroco
Preference Analysis and Competitive Positioning Auto Imagery Illustration Variance Accounted for Variance Percent Dimension 1 8.801 0.50 Dimension 2 6.896 0.39 Dimension 3 1.195 0.07 Dimension 4 0.619 0.04 Dimension 5 0.101 0.01 Dimension 6 0.000 0.00
Preference Analysis and Competitive Positioning Auto Imagery Illustration Brand Positions/Locations Dimension 1 Dimension 2
Preference Analysis and Competitive Positioning Auto Imagery Illustration Correlations of Items with Dimensions Dimension 1 Dimension 2 22
Preference Analysis and Competitive Positioning Auto Imagery Illustration Plot of Objects and Attributes - Dimensions 1 and 2 Key for Number Spatial Positions Description A Celica B Fiero C Integra D Prelude E Pulsar F Scirroco 1 technological 2 futuristic 3 young 4 value 5 aggressive 6 fun 7 prestige 8 handling 9 quality 10 aerodynamic 11 manly 12 powerful 13 sporty 14 dependable 23
Preference Analysis and Competitive Positioning Auto Imagery Illustration 11 C 12 F B E Dimension 1 13 3 5 A 2 10 6 D 7 14 8 1 9 Dimension 2 24 * These points are of same coordinates: 4 14
Preference Analysis and Competitive Positioning 5. Understanding Preferences and Relation to Market Share Ideal-Point Preference Model Vector Preference Model Different types of reference functions. Ideal-point models have an intermediate "best level," e.g., sweetness, whereas for vector models more or less) is always more (less) preferred, e.g., waiting time, reliability. Increasing Preference Preference Preference Decreasing Preference Attribute Attribute Ideal Point Interpreting simple joint-space maps. In ideal-point maps distances directly indicate preference: the larger the distance from the ideal point, the less preferred the brand. In vector maps the product locations are projected onto a preference vector (dashed lines in b), and distances are measured along the preference vector. Ideal Point (I) A • • Preference Vector dIB dIA dAC • • A dAB B • C • • • B Ideal-point map A is preferred twice as much as B. (dIB = 2dIA (a) Vector map A is preferred to B and B is preferred to C. With reference to A, C is preferred half as much as B. (dAC = 2dAB) (b) 25
Budweiser Beck’s 5 1 4 3 2 Old Milwaukee Heineken Miller Stroh’s Meister Brau Coors Michelob Coors Light Old Milwaukee Light Miller Lite Preference Analysis and Competitive Positioning 6. Product Preference Maps preference product maps Attempts to position brands in the perceptual space in accordance with those product features or attributes that consumers view as most important in making evaluations of the brand or in choosing among alternative brands. Heavy Premium Budget Light
Brand Strength Body A 3 5 B 5 2 C 6 3 D 2 3 E 3 1 Segment 1 5 5 Segment 2 6 2 Segment 3 3 6 Segment 1 represents 50% of the market Segment 2 represents 25% of the market Segment 3 represents 25% of the market Preference Analysis and Competitive Positioning 6.1 Preference Mapping Framework Recognize that preferences will be related to the brands relative evaluations on strength and body. The extent to which a brand appeals to a segment depends on the “match” of what the segment wants and what the brand delivers.
Segment 2 strength brand A 6 5 4 3 2 1 Segment 1 Segment 3 brand B brand C brand D brand E body 0 1 2 3 4 5 6 Preference Analysis and Competitive Positioning 1. Plot brand positions and segment ideals (preferences) in attribute space.
D2 = (RA,i - RB,i)2 AB i D2 = (3 - 5)2 + (5 - 2)2 = 13 AB Preference Analysis and Competitive Positioning 2. Compute brand distances. The (squared) distance between brands A and B is where = summation and i indexes attributes thus A B C D E A 0 B 13 0 C 13 2 0 D 5 10 16 0 E 16 5 13 5 0
D2 = (RA,i - IS1,i)2 A,S1 i = (3 - 5)2 + (5 - 5)2 = 4 Preference Analysis and Competitive Positioning 3. Compute (squared) distances between brands and segment ideals. A B C D E S1 4 9 5 13 20 S2 18 1 1 17 10 S3 1 20 18 10 25
1/D2 1/4 A,S1 PA,S1 = = .36 J 1/DJ,S1 1/4 + 1/9 + 1/5 + 1/13 + 1/20 2 brands Preference Analysis and Competitive Positioning 4. Market Share for a brand is inversely related to distance from the segment’s ideal: A B C D E S1 .36 .16 .29 .11 .07 S2 .03 .45 .45 .03 .04 S3 .80 .04 .04 .08 .03
MSA = .50(.36) + .25(.03) + .25(.80) = .3875 MSB = .50(.16) + .25(.45) + .25(.04) = .2025 MSC = .50(.29) + .25(.45) + .25(.04) = .2675 MSD = .50(.11) + .25(.03) + .25(.08) = .0825 MSE = .50(.07) + .25(.04) + .25(.03) = .0525 Preference Analysis and Competitive Positioning 5. And a brand’s share can be computed from a weighted average of these preference distances where the weight is the segment size A B C D E S1 .36 .16 .29 .11 .07 S2 .03 .45 .45 .03 .04 S3 .80 .04 .04 .08 .03
2 3 5 1 4 2 4 1 5 3 Preference Analysis and Competitive Positioning 6.2 Incorporating Price Dollar-Metric An example of a perceptual map with and without "dollar-metric" modification, showing that Signal is dominated by the other brands on both attributes unless price is considered. Source: Urban and Star 1991, pp. 138-139 Listermint Signal Signal Fights Bad Breath/$ Fights Bad Breath Listerine Listerine Listermint Scope Scope Cinnamon Listermint Cinnamon Listermint Pleasant Taste (a) Pleasant Taste/$ (b)
Segmentation Key Questions Partitioning the market into distinct subgroups who share commonalties with respect to the way they respond to product features and other marketing mix elements. Are there groups of customers that have different needs and therefore respond differently to price, product, promotion or channel? Structuring Key Questions Activities that shed light on the competitive relationships among a set of brands/ products. What competes against what and to what extent? Positioning Key Questions Activities directed toward portraying the interrelationships among a set of brands/products in terms of consumers’ similarity perceptions or preferences. How is my brand evaluated on the set of dimensions that define the interrelationships among the brands in the market and ultimately drive choice? Preference Analysis and Competitive Positioning 7. Strategic Market Studies Strategic market studies are designed to address three key components. 34
Product Segment (Ideal Point) 1 2 3 A B C D X1, flavor 2 -1 -3 1 -2 -2 2 X2, aroma 1 2 -3 2 1 -1 -2 Segment share 40% 30% 20% 10% Preference Analysis and Competitive Positioning 8. Practice Problems 8.1 A study of consumers' perception of coffee revealed that they could be described in terms of two dimensions, X1 and X2, which were described as flavor and aroma. The location of the three brands in the market are shown in the table, as is the location of four consumer segments, described in terms of their ideal points. a. Estimate the expected market shares for each brand in each segment. b. Suggest a marketing strategy for product 3. 35
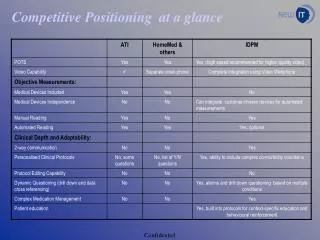
Preference Analysis and Competitive Positioning 8.2 Based on the attached perceptual map and associated data, analyze the competitive position of Lucent. Number of Individuals 200 Number of Objects 4 Ideal Object is 0 Number of Attributes 11 Data Input is Raw cases Object Codes: 1 2 3 4 Group/Object Labels Incidence(size) A ARRIS 50 B CISCO 50 C LUCENT 50 D MOTOROLA 50 Mean Score Attribute by Object Matrix ARRIS CISCO LUCENT MOTOROLA 1 high speed data access 6.020 8.540 6.000 6.060 2 telephony 6.204 6.800 7.640 5.700 3 scalability 6.245 7.440 7.260 6.120 4 reliability 6.510 7.860 7.240 6.300 5 new revenue streams 6.163 7.700 7.000 6.340 6 deploy solutions 5.918 7.520 6.640 6.020 7 help strategic decisions 6.125 7.680 7.040 6.140 8 fit vendor vision to us 6.061 7.480 6.600 6.200 9 share risk 5.776 6.540 5.980 5.460 10 commitment to industry 7.163 8.020 7.560 7.480 11 fit to company 6.163 7.600 7.080 6.060 Attribute Labels 1 high speed data access 2 telephony 3 scalability 4 reliability 5 new revenue streams 6 deploy solutions 7 help strategic decisions 8 fit vendor vision to us 9 share risk 10 commitment to industry 11 fit to company 34
Correlations of Items with Dimensions 1 high speed data access -0.88553 -0.46458 2 telephony -0.59164 0.80620 3 scalability -0.92920 0.36959 4 reliability -0.99072 0.13592 5 new revenue streams -0.99942 0.03398 6 deploy solutions -0.99913 -0.04173 7 help strategic decisions 0.12214 -0.99251 8 fit vendor vision to us -0.13560 -0.99076 9 share risk -0.00991 -0.99995 10 commitment to industry -0.20391 -0.97899 11 fit to company 0.19533 -0.98074 Dimension 1 Dimension 2 Preference Analysis and Competitive Positioning Plot of Objects and Attributes in Reduced Two-Dimensional Space - Dimensions 1 and 2 Key for Spatial Position Number Description A AARIS B CISCO C LUCENT D MOTOROLA 1 high speed data access 2 telephony 3 scalability 4 reliability 5 new revenue streams 6 deploy solutions 7 help strategic decisions 8 fit vendor vision to us 9 share risk 10 commitment to industry 11 fit to company Variance Accounted for Variance Percent Dimension 1 15.517 0.61 Dimension 2 9.715 0.38 Dimension 3 0.180 0.01 Dimension 4 0.000 0.00 37
Preference Analysis and Competitive Positioning Plot of Objects and Attributes - Dimensions 1 and 2 A D Dimension 1 C B Dimension 2 38
Preference Analysis and Competitive Positioning 8.3 A locally based pharmaceutical company manufactures a headache remedy, Feelgood. You have been hired to assess the current positioning of Feelgood relative to major competitors, as perceived by consumers, and to make recommendations for repositioning if necessary. Consumers consider two attributes to be of prime importance when selecting a headache remedy: Gentleness and effectiveness. In fact, these benefits define three segments that exist in this market: consumers who want the most effective brand (about 20% of the market), those who want the gentlest brand (about 50% of the market), and those who want a balance between the two benefits ( the remainder). These are referred to as Segments 1 through 3 respectively. Feelgood, and Brand B, are the gentlest brands on the market, while C and D are judged to be more effective by consumers. You have the following information about segment preferences and perceived brand positions: Attribute 1 Attribute 2 (Gentleness) (Effectiveness) Segment 1's Ideal -1 2 Segment 2's Ideal 2 -1 Segment 3's Ideal 1.5 1.5 Attribute 1 Attribute 2 (Gentleness) (Effectiveness) Feelgood's Position 1 -1.25 Brand B's Position 1.75 -0.5 Brand C's Position -1.5 0.5 Brand D's Position -0.5 1.5 39
Preference Analysis and Competitive Positioning a. Obtain a perceptual map that reflects current perceived positions. What can you say about Feelgood's position? is is well situated in this market? b. What is the current market share of the Feelgood brand? c. Feelgood management is considering four strategies which are described below. Would you recommend any of these positions as particularly good from Feelgood's point of view? Position of Position on Strategy Attribute 1 Attribute 2 1.75 -1.25 Closer to Segment 2 1 1 Closer to Segment 3 0.5 0.5 Closer to Segment 3/away from Brand B -1 1.5 Closer to Segment 1 d. Suppose that Feelgood follows the first strategy given above (1.75, -1.25). If you were Brand B how would you defend yourself? Propose a specific strategy. 40


![Preference Elicitation [Conjoint Analysis]](https://cdn2.slideserve.com/5322185/preference-elicitation-conjoint-analysis-dt.jpg)