Download
1 / 56
560 likes | 666 Vues
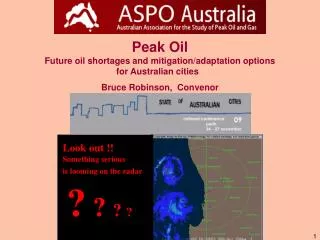
Peak Oil Oil shortages will soon pose a significant problem for transition Bruce Robinson, Convenor. Look out Europe !! Something serious is looming on the radar. ? ? ? ?. We are part of the international ASPO alliance, based in Uppsala, Sweden. www.ASPO-Australia.org.au

E N D
Peak Oil Oil shortages will soon pose a significant problem for transition Bruce Robinson, Convenor Look out Europe !! Something serious is looming on the radar ? ? ? ?
We are part of the international ASPO alliance, based in Uppsala, Sweden www.ASPO-Australia.org.au An Australia-wide network of professionals working to reduce oil vulnerability Working groups Urban and transport planning Finance Sector Health Sector Social Services Sector Regional and city Remote indigenous communities Active transport (bicycle & walking) Agriculture, Fisheries and Food Biofuels Oil & Gas industry Construction Industry Public transport sector Defence and Security Economics Tourism Children and Peak Oil Young Professionals working group
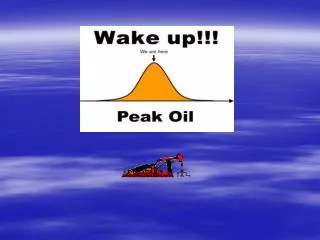
Peak Oil but when? 2050 2010 1970 1930 Outline This is about Oil, not energy in general. Transport Energy (largely) Global oil supply, not just Europe's It is not about Climate Change ●What is Peak Oil ? the time when global oil production stops rising and starts its final decline We will never "run out of oil“ ● Peak Oil will probably hit Europe sooner and harder than climate change ●When is the most probable forecast date ? ? 2012 +/- 5 years ● “Peak Exports” will arrive sooner, as exporting countries use more of their own oil internally, leaving less for export ● Governments and communities must consider Peak Oil risks urgently. Oil vulnerability mitigation and adaptation strategies must be devised and implemented.
Jeremy LeggettOctober 29 2008 • Time for an energy bail-out • Peak oil is just five years away, and we must start to plan now to avert a truly ruinous crisis • Previously unimaginable policy interventions in financial markets have suddenly become imperative, • and similar interventions in energy markets today may be worth their weight in gold tomorrow. www.peakoiltaskforce.net
IEA November 2008 The world is heading for a catastrophic energy crunch that could cripple a global economic recovery because most of the major oil fields in the world have passed their peak production, a leading energy economist has warned. (IEA’s Fatih Birol) The IEAestimates that the average production-weighted observed decline rate worldwide is currently 6.7% pa for fields that have passed their production peak”.
2008 Even if oil demand were to remain flat to 2030, 45 m barrels/day of gross capacity -roughly four times the capacity of Saudi Arabia - would be needed just to offset the decline from existing fields
THE GROWING GAP Regular Conventional Oil Billion barrels of oil per year Longwell, 2002
But…. • Key oil figures were distorted by US pressure, says whistleblower • Exclusive: Watchdog's estimates of reserves inflated says top official • guardian.co.uk, Monday 9 November 2009 The world is much closer to running short of oil than official estimates admit, according to a whistleblower at the International Energy Agency who claims it has been deliberately underplaying a looming shortage for fear of triggering panic buying.
Published in Energy Policy, November 2009 Prof Kjell Aleklett Global Energy Systems Uppsala University, Sweden The Peak of the Oil Age - Analyzing the world oil production Reference Scenario in World Energy Outlook 2008
International Energy Agency (OECD) World Energy Outlook 2008 Uppsala University Global Energy Systems group 2009 2008 2008 Different World oil production forecasts (million barrels/day) using the same reserve data } IEA 106 Mb/day 41% Uppsala 75 Mb/day 2008 2020 2008 2020 2030 IEA Uppsala 2030 Using the same IEA reserve data Different conclusions. IEA production forecasts are "outside reality", not possible. (because IEA have assumed impossible production rates from the reserves)
Dr. Sadad I. Al Husseini, ex Saudi Aramco • Oil and Money Conference, London, October 30, 2007 ...predicts a 10 year plateau a structural ceiling determined by geology Production M b/day Price $/barrel 100 90 80 70 The economic mantra is that as prices rise, production will increase. Clearly not true from these data.
World Oil Production and Forecasts2012 +/- 5 years ? IEA 2002 Dr Ali Samsam Bakhtiari Iran 4 4 2006 40 Prof. Bauquis France Shell 2008 0 0 3 3 30 Deffeyes Bauquis, Total 0 0 Gb pa 2 2 20 ASPO & Skrebowski 0 0 1 1 10 0 0 2009 0 0 0 0 1930 1970 2010 2050 Chris Skrebowski UK Zittel & Schindler Germany Prof. Aleklett, ASPO Sweden 1 1 2 2 4 4 6 6 8 8 10 10 12 12 1 1 1 1 1 1 1 1 1 1 1 1
A simple observation -- or why peak will be earlier than most people expect Chris Skrebowski Petroleum Review London ‘Global production falls when loss of output from countries in decline exceeds gains in output from those that are expanding.’
Australia uses 51,000 megalitres of oil each year a 370m cube Sydney Harbour Bridge is 134 m high 80% of Australia’s oil usage is in transport If Australia’s 20 M tpa wheat crop → ethanol = 10%
How much energy is bound in oil? 100 ml of oil contains 1 kWh What can you do with 1 kWh? You can move a small car to the top of the Eiffel Tower! Filling your car with 50 litres is equal to the energy you need to move 500 cars to the top of the Tower.
50 litres of gasoline is equal to the work of 1000 persons during one day A day’s work for a man is 0.5 kWh = 50 ml of petrol
Million barrels/ day 2008 BP Statistical Review, 2009 Australia uses 0.9 China 8.0 Europe 14.8 US 19.4 World 84.5 US 1 cubic km oil / year 1 km l l Australia Europe United States
Million barrels/day 16 Consumption 12 EU (+ Norway) oil consumption and production (BP Statistical Review, 2009) 8 4 Production 0 Caution: BP does not report all 27 EU countries separately CY,EE,LV,MT and SL omitted. Norway included as European oil producer
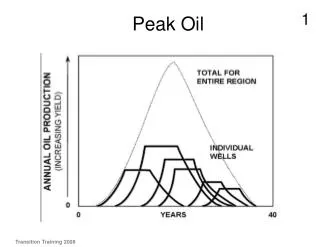
Big fields are found first, and as they decline, they are replaced by smaller and smaller fields soon the additional small fields can not match the decline of the large fields, so the overall production begins its final decline
Per capita oil consumption (Barrels/day/1000 people) EU plus some others 2008 USA Australia Japan Austria Bangladesh China
ENERGYFILES www.energyfiles.com Rich Poor Energyfiles Ltd Oil consumption is not shared equitably US: 5% of world's population uses ~ 25% of world oil
Mortgage and Oil Vulnerability in Perth Mapping oil vulnerability at high resolution provides useful information for planners. Like US cities, the outer suburbs of Australian cities are more at risk from rising fuel prices and mortgage interest rates. Oil vulnerabilities of cities and regions would be very useful to see where the biggest oil vulnerability risks are (and to help devise relevant mitigation and adapation stragies) www.griffith.edu.au/__data/assets/pdf_file/0003/88851/urp_rp17_dodsonsipe-2008.pdf
www.ASPO-Australia.org.au General priorities for facing Peak Oil 1: Awareness and engagement 2: Frugality 3: Efficiency 4: Equity Low priority Alternative fuels and technologies Failure to act now will prove incredibly costly Noah built the Ark before the flood. It is very hard to build an ark under water. Oil vulnerability assessment and risk management are crucial, important tools for planners. Bruce.Robinson@ASPO-Australia.org.au 61 427 398 708 61-8-9384-7409
a few more slides follow, in case they are needed for questions
Government Policy and Action Options 1: “Talk about it, Talk about it” 2. Engage people, “Participatory democracy” 3. Dismantle the "perverse policies" that subsidise heavy car use and excessive freight transport. 4. Encourage frugal use of fuel, and disadvantage profligate users. Fuel taxes should be incrementally raised to reduce usage. 5: SmartCard personal fuel allocation system. A flexible mechanism for short-term oil shocks, as well for encouraging people to reduce their fuel usage.. 6. Concentrate on the psychological and social dimensions of automobile dependence, not just “technological fixes” 7. Implement nationwide "individualised marketing" travel demand management. 8. Railways, cyclepaths and public transport are better investments than more roads. 9. Give priority for remaining oil and gas supplies to food production, essential services and indigenous communities, using the Smart-Card system. 10. Review the oil vulnerability of every industry and community sector and how each may reduce their risks. 11 Promote through the United Nations an Intergovernmental Panel on Oil Depletion, and a Kyoto-like protocol to allocate equitably the declining oil among nations. An international tradable sliding scale allocation mechanism is one hypothetical option.
Australian petrol & diesel rationing using 2010 technology Smart-card based, scalable, tradeable, flexible, quick to change, equitable, transparent. Fuel allocations should be per person, not per vehicle, and depend on Location (inner or outer suburb, public transport access, regional or remote) Health status (elderly or infirm, expectant mothers with toddlers), less for the fit who can ride a bicycle 20kms if needed Job importance (defence, essential services, hospitals, food) People are encouraged to conserve by being able to trade unused allowances electronically and automatically. Martin Feldstein, Chief Economic Advisor to President Reagan, now at Harvard, (WSJ 2006) "tradeable gasoline rights are more efficient than fuel economy standards or gasoline taxes"
Gb/year Efficiency Demand Growth World oil shortfall scenarios Transport mode shifts Pricing / taxes City design/lifestyle Past Production of Oil Other petroleum fuels gas, tar-sands Other fuels Deprivation, war Forecast Production 2009 • no single “Magic Bullet” solution, • probably no replacement ever for cheap plentiful oil • Urgent preparation and adjustment are vital
Million barrels/day Consumption EU (+ Norway) and Australia 3.0 DE FR 2.0 IT UK ES NL 1.0 Aus B+LU AT 0
} Gb/year 50 Demand Trend World oil shortfall scenarios 40 Shortfall Past Production of Oil 30 20 Forecast Production 10 2007 2030 0 By 2030, the gap is equivalent to 6,000 nuclear reactors
“OK, it’s agreed – we announce that to do nothing is not an option and then we wait and see how things pan out”from ‘Private Eye’
Government of Western Australia STATE LIQUID FUEL SHORTAGE EMERGENCY PLAN OPERATIONALPLAN PREPARED BY ENERGY SAFETY DIRECTORATE DEPARTMENT OF CONSUMER AND EMPLOYMENT PROTECTION 20 Southport Street, W Leederville WA 6007 Tel: (08) 9422 5200 Fax: (08) 9422 5244 January 2003 Current WA Government planning for a sudden fuel shortage Ineffective and inequitable. Odds & Even number plates etc Nothing significant about public transport
Perth domestic water prices per kilolitre 2008 Consumption range kilolitre/year Water Analogy for Fuel Pricing A personal fuel SmartCard system could tax petrol and diesel on a sliding scale like water. People could trade unused allocations to those who want more fuel. A rational pricing system Perth domestic water Renewable scarce resource
There are innumerable “Perverse” subsidies FBT tax on cars as part of salary to roads, 4WDs profligate vehicle users heavy inefficient vehicles Supermarkets subsidise CO2 $18/tonne with their fuel dockets Supermarket petrol discounts People who walk to the supermarket are subsidising those who drive in the big SUVs
Petrol taxes OECD € UK Au$ cents/litre 0.80 Korea 0.60 Australia 0.40 0.20 US 0.00 IEA Dec 2003
The UK Fuel Tax Escalator Margaret Thatcher pence Nominal tax per litre (pence) 50 Real tax 40 30 20 10 0 1988 1990 1992 1994 1996 1998 Australian fuel taxes should be raised to European levels on a fuel tax escalator
Australia US China
Bicycles are powered by biofuel, renewable energy, either Weetbix or abdominal fat No shortage of either www.ASPO-Australia.org.Au
Sunshine Coast Regional Council September 2009 Maribyrnong City Council’s Peak Oil Contingency Plan a first for Australia
Urban passenger mode shares Australia Car High automobile-dependence Public transport share is very low Potterton BTRE 2003
Million barrels per day (equivalent) 140 120 100 80 60 40 20 0 2009
Iran 10c/litre Venezuela 2c/l Jeff Rubin September 2007 Canadian Imperial Banking Corporation www.aspo-ireland.org/contentfiles/ASPO6/2-3_ASPO6_JRubin.pdf
from Oilwatch Monthly: ASPO-Netherlands Rembrandt Koppelaar