Download
1 / 48
480 likes | 587 Vues
Trade Promotion and Investment: Peru. Julio Velarde Governor , Central Reserve Bank of Peru. Background information. * Forecast. 2. Agenda. Solid fundamentals Sectoral opportunities Outlook. Per capita GDP growth in the last decade has been the highest of the past 60 years….

E N D
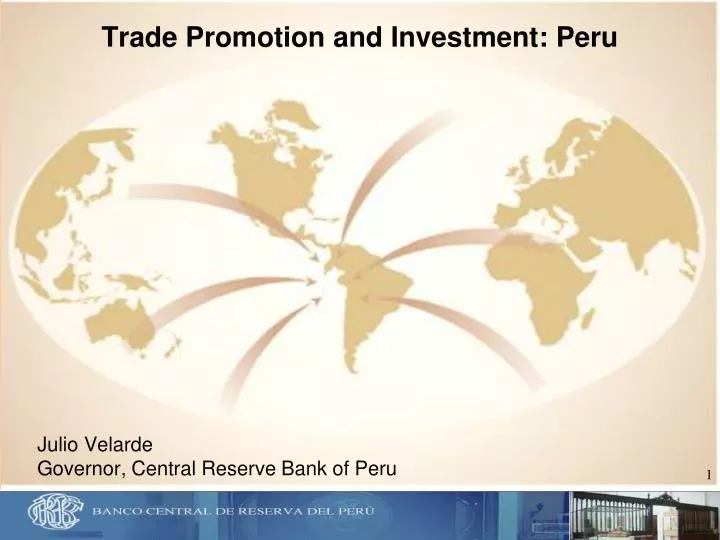
Trade Promotion and Investment: Peru Julio Velarde Governor, Central Reserve Bank of Peru
Background information * Forecast 2
Agenda • Solid fundamentals • Sectoral opportunities • Outlook
Per capita GDP growth in the last decade has been the highest of the past 60 years…
Per capita GDP has also been one of the fastest growing in the region. GDP Per Capita Growth 1/ (Number of times) 2009 / 1980 2009 / 1990 2009 / 2000 1 Chile 5,06 Chile 2,97 Peru 1,72 2 Uruguay 3,79 Peru 2,69 Ecuador 1,63 3 Colombia 3,51 Argentina 2,52 Uruguay 1,60 4 Ecuador 2,96 Uruguay 2,46 Colombia 1,54 5 Peru 2,94 Colombia 2,04 Argentina 1,53 6 Argentina 2,91 Ecuador 2,01 Chile 1,50 7 Brazil 2,79 Bolivia 1,96 Venezuela 1,46 8 Mexico 2,75 Brazil 1,96 Brazil 1,45 9 Paraguay 2,37 Mexico 1,86 Bolivia 1,43 10 Bolivia 2,30 Venezuela 1,78 Paraguay 1,36 11 Venezuela 2,27 Paraguay 1,54 Mexico 1,27 1/ Based on Purchasing Power Parity. The current per capita GDP is compared with 1980, 1999 y 2000. 5
Peru’s growth has been the highest in Latin America. *Forecast IMF, World Economic Outlook
Lima: Labor Force 5,9 4,8 1,8 Labor Force Employed Labor Force Working-age population Employmentgrewaround 6 percent in Lima. June – July – August (annual percent change)
GDP Growth: 2008 - 2010 (Annual percent changes) 2,7 Colombia 0,8 4,4 1,5 Mexico - 6,5 4,7 3,7 Chile - 1,5 5,2 5,1 Brazil - 0,2 7,5 9,8 Peru 0,9 8,0 2008 2009 2010* Peruweatheredwelltheglobal crisis. * Forecast Source: Latin American Consensus Forecasts & BCRP
GDP: Selected Latin American countries (Seasonally adjusted data, 4Q2007=100) Peru 114 Brazil 110 Chile 106 Colombia 102 Mexico 98 94 90 4T07 1T08 2T08 3T08 4T08 1T09 2T09 3T09 4T09 1T10 2T10 Source: Central Banks and statistical institutions. . Strongdynamism in severalLatin American countries.
In July 2010, GDP grew 9,1 per cent Real GDP growth (Y-o-Y % Change) Lehman Brothers Bankruptcy GDP growth 2008: 8,9% GDP growth Jan.-Jul. 2010: 8,3% GDP growth 2009: 0,9%
Mainindicators show solidrecovery. * Preliminary
BUSINESS CONFIDENCE INDEX Economic Situation 80 75 74 74 72 72 Optimistic Zone 71 71 71 71 71 71 70 69 69 67 67 70 67 66 63 61 61 60 56 53 53 51 50 47 39 38 44 40 35 33 32 Pesimistic Zone 30 20 Jan - 08 Mar May Jul Sep Nov Jan - 09 Mar May Jul Sep Nov Jan - 10 Mar May Jul Aug Source : BCRP Survey on Macroeconomic Expectations , August 2010. The business confidence index remains in optimistic territory
Fiscal discipline improved public finances. Source: Latin American Consensus Forecasts.
Peru’sdebtburdenisone of thelowest in theregion. Source: Moodys – Peru: BCRP
Long-term capital flowscontributetocurrentaccountsustainability.
High international reserves reduce external vulnerabilities. Source: Moodys – Perú: BCRP
Total investmentwillreach 25% of GDP in 2010. * Forecast.
Economicgrowthalsosustainedbyhigherproductivity of factors Labour Productivity per employee: 1990-2009 (Annual average growth) 8,13 4,22 2,95 2,68 2,35 1,72 1,31 1,23 0,94 0,81 0,8 0,66 0,3 USA India Peru Chile Brazil Mexico China Bolivia Uruguay Ecuador Argentina Colombia Venezuela Source: The Conference Board Total Economy Database, Groningen institute, January 2010.
Peru’s favorable businessenvironmentisrecognizedinternationally.
Peru’s ranking in global competitiveness (139 countries) General Position 73 Legal system impact 17 Protection to investment 20 Access to property 21 Source: World Economic Forum –Global Competitivity Report
The Economist Peru: First in the region for legal and regulatory framework Peru 66,7 Chile 61,1 Mexico 50 Costa Rica 50 Brazil 47,2 Venezuela 8,3 Nicaragua 5,6 Ecuador 5,6 Source: The Economist 2009.
Favorable Legal Framework • Capital Mobility • Free competition • Clear guarantees for private property • Free remittance of earnings • Free access to foreign exchange market
Inflation in Peru: Thelowest in LatinAmerica in thelastdecade Inflation (%) (Average 2001 - 2009) Fuente: WEO-FMI,
Inflation remains within the target range (between 1 y 3 per cent)
The BCRP started to increase its reference rate after 9 months at a historical low of 1.25 percent.
Recovery of credittotheprivate sector in domestic and foreigncurrency Credit to the Private Sector (% Annual change)
Financialdollarizationremainson a decreasingtrend. *August. Source: BCRP
Agenda • Solid fundamentals • Sectoral opportunities • Perspectives
During the crisis, some investment projects were postponed. Nevertheless, announcements continued to increase. Announcements of Investment Projects 3 years forward (Billions of US$) Source: Press Media and information from companies.
Investmentisexpectedtobearound US$ 38 billion in 2010- 2012 Confirmed Investments : 2010-2012 Share % Other Sectors 9% Infrastructure 11% Mining Manufacturing 43% 9% Electricity Hydrocarbons 10% 18%
Geographical distribution of exports January - August 2010 Exports by product January - August 2010 United States Unidos 17,0% Copper 24,7% Others 33,6% Gold 22,9% China 16% Textile 4,3% Zinc 4,9% Latin America and Non traditional Caribe 15,7% Oil and Agriculture and European Union derivatives livestock 5,7% 17,4% 8,1% Fishmeal 5,7% Diversification of thecomposition and geographicaldistribution of exports
Non traditionalexportshave more thandoubled in thelast ten years.
Agenda • Solid fundamentals • Sectoral opportunities • Outlook
Theoutlookis positive forthenextyears. * Forecast.
Long-term capital inflowsfinancethecurrentaccount. * Forecast.
Peru’s fiscal deficitisdeclining and thedebtburdenwilldecreasetoaround 20 percentby 2012.
Peru’s economic outlook is favorable. • Foreign sector: High long-term external financing and adequate foreign reserves. • Public Sector: Low debt burden and room for counter-cyclical policy. • Financial Sector: Institutions adequately capitalized, with high liquidity and low non-performing loans. • Nonfinancial corporate sector: High returns and low indebtedness. • Household sector: Improving employment and incomes.
Trade Promotion and Investment: Peru Julio Velarde Governor, Central Reserve Bank of Peru

![IV. Various Costs of Trade and Trade Arrangements Direct and indirect costs of trade [Head, 59-90; R/H, 159-168]](https://cdn0.slideserve.com/22356/slide1-dt.jpg)