Download
1 / 45
450 likes | 460 Vues
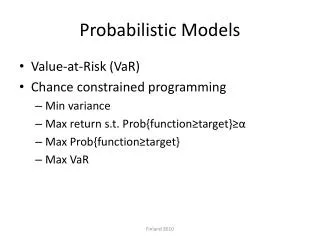
Probabilistic Models of Motorcyclists' Injury Severities in Single- and Multi-vehicle Crashes. Peter T. Savolainen, Ph.D. Wayne State University Fred Mannering, Ph.D. Purdue University. Overview. Background Research Objectives Methodology Multi-Vehicle Crash Severity Model

E N D
Probabilistic Models of Motorcyclists' Injury Severities in Single- and Multi-vehicle Crashes Peter T. Savolainen, Ph.D. Wayne State University Fred Mannering, Ph.D. Purdue University
Overview • Background • Research Objectives • Methodology • Multi-Vehicle Crash Severity Model • Single-Vehicle Crash Severity Model • Conclusions
Background • Ridership increasing • Riding population changing • Training • Age • Gender • Bike design • Speed • Power • Safety • Repealed helmet laws
Research Objective • To develop probabilistic models of motorcycle crash-injury severity using Indiana crash data from 2003 to 2005 • Single-vehicle • Multi-vehicle
Methodology – Multi-Vehicle • Multinomial logit (MNL) model with, Sin = βi Xin + εin • Sin is the function that determines the probability of severity i for crash n, • Xin is a vector of measurable characteristics (motorcyclist and roadway characteristics) that determine the severity level for crash n, • βi is a vector of estimable coefficients, and • εin is an error term accounting for unobserved effects influencing the injury severity of crash n
Methodology – Multi-Vehicle • if εin are assumed to be extreme value distributed (see McFadden, 1981), then a standard multinomial logit model results, • where Pn(i) is the probability that crash n will result in severity i and I is the set of possible injury severity levels (PDO/Possible, Non-incapacitating, Incapacitating, Fatal).
Methodology – Multi-Vehicle • Elasticity • Pseudo-elasticity
Some Multi-Vehicle Crash Severity Model Findings Severity level; No injury: • Factors decreasing no-injury likelihood: • Alcohol use (other motorist) (65%) • Head-on collision (35%) • Motorcycle age
Some Multi-Vehicle Crash Severity Model Findings Severity level; Incapacitating injury: • Factors increasing incapacitating-injury likelihood: • Motorcyclist speeding (50%) • Motorcyclist age (4.2% per 1% increase in age) • Vertical curve (81%) • Horizontal curve (45%)
Some Multi-Vehicle Crash Severity Model Findings Severity level; Fatality: • Factors increasing fatality likelihood: • Motorcyclist at fault (126%) • Motorcyclist speeding (116%) • Head on collision (566%) • Factors decreasing fatality likelihood: • Helmet use (right angle) (61%)
Methodology – Single Vehicle • If εin are correlated (crash severity levels share unobserved effects): • where Pn(ji) is the probability of crash n resulting in injury severity j conditioned on the injury severity being in injury-severity category i, J is the conditional set of outcomes (conditioned on i), I is the unconditional set of outcome categories, LSin is the inclusive value (logsum), and i is an estimable parameter.
Some Single-Vehicle Crash Severity Model Findings Severity level; Minor or No injury: • Factors increasing minor/no-injury likelihood: • Motorcycle less than 5 years old (20%) • Helmet used (50%) • Factors decreasing minor/no-injury likelihood: • Motorcyclist age (1.15% per 1% increase in age) • Alcohol use (10%) • Speeding (14%) • Collisions with trees, poles, curbs, culverts, guardrails)
Some Single-Vehicle Crash Severity Model Findings Severity level; Fatality: • Factors increasing fatality likelihood: • Over 2 years since took BRC (171%) • Speeding (212%) • Run-off-road (137%) • Collision with tree (525%) • Collision with pole (344%)
Conclusions • Critical areas • Poor visibility • horizontal curvature, vertical curvature, darkness • Unsafe speed • Risk-taking behavior • alcohol use, not wearing a helmet • Collision type • Right-angle, head-on, and collisions with fixed objects • Age
Conclusions • Critical areas (continued) • Rider training (BRC results) • Degradation in skills, self-selectivity, risk compensation? • Encouragingly, crashes were found to be less severe: • Under wet pavement conditions • Near intersections • When passengers were on the motorcycle
Additional Evidence on the Effectiveness of Motorcycle Training and Motorcyclists’ Risk-taking Behavior Peter T. Savolainen, Ph.D. Wayne State University Fred Mannering, Ph.D. Purdue University
Overview • Background • Research Objectives • Methodology • Crash Propensity Model • Top Travel Speed Model • Helmet Usage Model • Conclusions
Background • Rider education and training critical to motorcycle safety agenda • Limited research on education/training programs • Contradictory results • Methodological shortcomings
Background • Methodological shortcomings: • Lack of consideration of variables beyond violation and crash statistics • Lack of control for exposure • Not fully considering dissimilarity between trained/untrained riders • Not considering possible risk compensation
Research Objectives • To provide additional evidence on effectiveness of motorcycle training courses • Motorcyclist survey • Using 2005 sample of Indiana motorcyclists
Motorcyclist Survey • Survey developed to collect data on: • Demographics • Training history • Riding behavior • Crash involvement • 2 groups of riders • Trained: ABATE of Indiana – MSF Basic Rider Course (BRC) • Untrained: Indiana BMV and ABATE newsletter • Surveys mailed to 4,000 riders from each group • Over 1,300 responses obtained
Motorcyclist Survey • Why ABATE? • Why combine samples? • Not statistically different. Proof: likelihood ratio test • LL(βR) = log-likelihood of restricted model • e.g., BMV only sample • LL(βU) = log-likelihood of unrestricted model • e.g., BMV and ABATE sample • Combining allows more precise parameter estimates
Summary Statistics • Average age 47.8 • 84% male, 16% female • Completed BRC 60% • Multiple times 6% • Completed ERC 12% • ABATE members 46% • Annual exposure • <1000 23% • 1000-5000 51% • Over 5000 26%
Summary Statistics • Type of Motorcycle • Sportbike: 15% • Cruiser: 46% • Touring: 27% • Other: 12%
Summary Statistics • Reasons for not taking BRC • No need to take course: 47% • Could not find time: 34% • Unaware of course: 15% • Could not afford program cost: 4%
Summary Statistics • Helmet usage frequency • Always/Usually: 56% • Sometimes: 21% • Rarely/Never: 23%
Methodology • Multinomial logit models developed with, Rin = βi Xin + εin • Rin is the function that determines the probability of response i being chosen by motorcyclist n, • Xin is a vector of measurable characteristics (socioeconomics and rider perceptions) that determine the response of motorcyclist n, • βi is a vector of estimable coefficients, and • εin is an error term accounting for unobserved effects influencing the response of motorcyclist n
Methodology • if εin are assumed to be extreme value distributed (see McFadden, 1981), then a standard multinomial logit model results, • where Pn(i) is the probability that motorcyclist n will choose response i and I is the set of possible survey responses.
Crash Propensity Model • Cni is a function that determines crash propensity • Xni is a vector of rider characteristics
Crash Propensity Model Crash propensity increaseswith: • Not wearing helmet (63%) • Ride over 100 mph in past 12 mo. (161%) • Sportbike (54%) • Ride over 10,000 mi/yr (102%) • Age under 35 (59%) • Completed BRC once (44%) • Completed BRC more than once (180%)
Crash Propensity Model Crash propensity decreases with: • Citing no need for BRC (51%) • Riding experience • Highest during 1st year • Decreases years 2-4 (58%) • Increases slightly year 5+ • Riding 500-1000mi/yr (64%)
Crash Propensity Model Note on BRC findings: • Completed BRC once (increases crash 44%) • Completed BRC more than once (increases crash 180%) • Cited no need for BRC (decreases crash 51%) • Evidence that BRC riders may be a self-selected group of inherently less-skillful riders
Maximum Speed Model • Binary logit model for maximum speed • MSni is a function that determines maximum travel speed • Xni is a vector of rider characteristics
Maximum Speed Model • Increasing probability of riding over 90 mph: • Motorcycle primary mode of travel (42%) • Usually wear a helmet (39%) • Sportbike riders (128%) • Drank alcohol within 2 hrs of riding (66%) • Licensed at 40+ years old (38%) • Ride 5-10K miles per year (106%) • Ride over 10K miles per year (189%) • Involved in crash/near-miss (30%)
Maximum Speed Model • Decreasing probability of riding over 90 mph: • Rider age (1.82% per 1% increase in age) • Female riders (61%) • Smaller engines • Usually wear protective clothing/equipment (30%)
Helmet Usage Model • Multinomial Logit for helmet usage • Xni rider characteristics • Hni is equal to: • 1 : Always/Usually • 2: Sometimes • 3: Rarely/Never
Helmet Usage Model • Always wear helmet: • Typically wear other protective equipment or reflective clothing/equipment • Typical travel speed over 70 mph • Typical travel speed less than 60 mph • Older riders • Number of bikes owned
Helmet Usage Model • Never wear helmet: • Motorcycle primary mode of travel • Never wear other protective equipment • Larger engine displacement • Rode over 100 mph in past year • Involved in near-miss in past year • Drank alcohol within 2 hrs of riding • Females • ABATE members • Except for those completing BRC • Self-rated as excellent rider
Conclusions • Individuals taking BRC are more likely to be crash-involved • Inherently less capable riders? • Overcompensation of risks with learned material? • Skill-measurement methods must be developed and research undertaken to understand how skills can be improved considering: • Risk compensation • Self selection of less skilled rider to training courses
Future Research Directions • Improvement of crash records system • Further research into rider training, self-selectivity into training courses, and risk compensation induced by course-taught material • Improvements to Rider Training Program • Baseline evaluation • Further application of survey methodology • Regional/national level • Focus on other issues