Download

1 / 22
220 likes | 320 Vues
Increase Student Learning with a Histogram Chart. Do Not Give Students Permission to Forget. For the purpose of teaching how to create a Histogram in Excel, we are going to use data on student success in remembering vocabulary for a particular class.

E N D
Increase Student Learning with a Histogram Chart IT Cadre 2006
Do Not Give Students Permission to Forget • For the purpose of teaching how to create a Histogram in Excel, we are going to use data on student success in remembering vocabulary for a particular class. • A quiz will be given every other week on a sampling of vocabulary for the class. • The results of each quiz will be charted in a Histogram. • The teacher will share the chart with the students to form a plan to increase student success. IT Cadre 2006
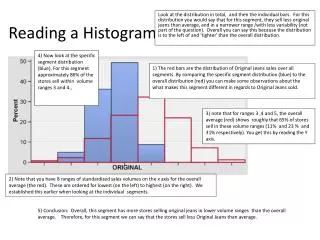
L to J Charts Your first quiz would show a chart in the form of the Lbecause students would be unfamiliar with vocabulary. As students’ quiz scores improve, the chart would move to a Bell Shape. Your final assessment would look like a J because most students would have mastered the vocabulary. IT Cadre 2006
Data Collection Using Vocabulary Quizzes • Make a list of the vocabulary that students need to learn for background knowledge for the entire year (example: 100 words). • Write each word on a separate index card and place them in a fish bowl. • Give a quiz bi-weekly on a sampling of words pulled randomly from the fish bowl. • The sampling should equal the square root of the total number of words (example: the square root of 100 is 10). IT Cadre 2006
Quiz • Give the quiz. • Put the results in an Excel Spreadsheet. • Create a bar graph (Histogram) to illustrate your results. • Share and discuss your results with the class. IT Cadre 2006
Creating a Histogram Chart in Excel IT Cadre 2006
Entering Data into Excel. • Open a new worksheet in Excel. • Enter your data. IT Cadre 2006
Highlight Data in Column B To highlight, click Cell B2, then hold the left mouse down as you drag the cursor down to the last data cell in the column. B2 Last data cell IT Cadre 2006
Click on the Chart Wizard IT Cadre 2006
Click on Next Click on Column IT Cadre 2006
Click on the Series Tab: IT Cadre 2006
Click on this symbol C IT Cadre 2006
Highlight Data in Column A Select data in cell A2 through the last data cell in column A. Press the ENTER key IT Cadre 2006
Click Next IT Cadre 2006
Type in Chart Titles Bi-Weekly Quiz 1 Scores Number of Students Click Next. IT Cadre 2006
Right Click on X axis (scores) Click on Series 1. Press delete. IT Cadre 2006
Use the arrow keys to change the degrees to 45. Click OK. IT Cadre 2006
Choosing your Chart Location: If you choose the default As object in: it will place it one your spreadsheet. If you choose As new sheet: it will save it as a separate sheet. IT Cadre 2006
Finished Histogram for Bi-Weekly Quiz 1 IT Cadre 2006
Feedback • Ask students.. ”How can we improve our scores on our next quiz?” • Help the class to agree on a plan to improve. • Continue to give a quiz every other week throughout the school year. • Discuss the results of each quiz using the histogram. IT Cadre 2006
Finished Histogram for Bi-Weekly Quiz 18 IT Cadre 2006
L Chart J Chart IT Cadre 2006