Download
1 / 12
200 likes | 416 Vues
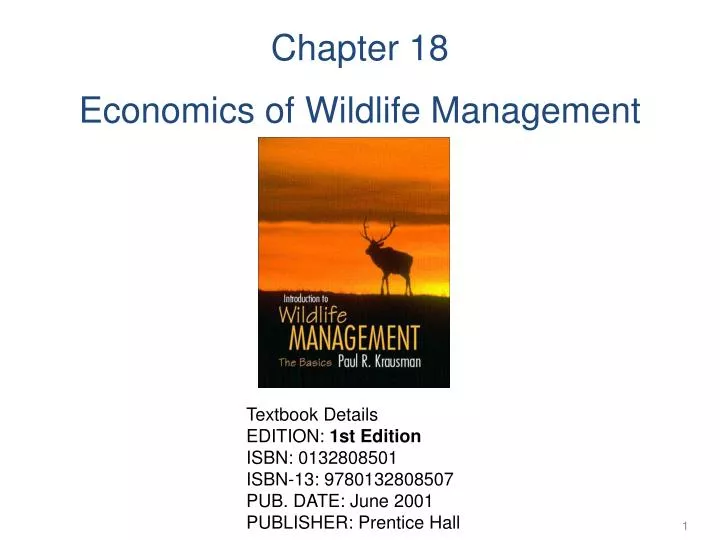
Chapter 18 Economics of Wildlife Management. Textbook Details EDITION: 1st Edition ISBN: 0132808501 ISBN-13: 9780132808507 PUB. DATE: June 2001 PUBLISHER: Prentice Hall. Douglas squirrel: a pine squirrel; its appearance varies according to the season. kit foxes.

E N D
Chapter 18 Economics of Wildlife Management Textbook Details EDITION: 1st Edition ISBN: 0132808501 ISBN-13: 9780132808507 PUB. DATE: June 2001 PUBLISHER: Prentice Hall
Douglas squirrel: a pine squirrel; its appearance varies according to the season kit foxes California desert sheep America’s bats are dying due to “white-nose syndrome”: one million insect-eating bats from 10 states and adjacent areas of Canada have died since winter 2006 greater sage-grouse: an icon of western sagebrush ecosystems
1. Wildlife Ecology and Human Institutions Population Growth Curves • Regardless of the objective of wildlife management—hunting, ecotourism, predator control—the critical relationship is the growth dynamics of the wildlife population of interest • A population increases, decreases, or remains constant due to factors such as food availability, sex ratios, fecundity and mortality rates, and predation pressure • From 1937 to 1943, wildlife biologist Arthur Einarsen studied the way a population of pheasants grew after the species was introduced onto an island (“Specific Results from Ring-Necked Pheasant Studies in the Pacific Northwest,” Transactions, Seventh N. A. Wildlife Conference, 1942, pp. 130-138.) http://www.youtube.com/watch?v=rDY0vs8WQnU
Population Growth Curves (con’t) • Figure 18-1, page 357 • Panel (a): For the first few years population increases were modest, but then the rate of change increased greatly. In 1941 the increment reached its maximum, and the next year it was lower. It was expected that around 1946, the population would meet its maximum, the carrying capacity for the habitat • Panel (b): logistic growth curve—an inverted U curve showing how the annual increment in a population is related to the size of that population (the annual increment of small population is relatively low; it reaches a maximum at population size of 1,400 pheasants; then drops to zero at a population of 2,600)
Population Growth Curves (con’t) • 2,600: carrying capacity; 1,400: the stock size that defines maximum sustainable yield, the maximum quantity of the wildlife that could be harvested on a sustainable basis • An economic optimum (social efficiency) differs from the biological point of maximum sustainable yield • Social efficiency should take into account other sources of value such as value for recreational hunting, value for ecotourism, value for biological diversity, existence value, and uncertainty
Wildlife Management Practices • The dominant landowning tradition in the U.S. is private property • Small land holdings (by each of a number of private owners) relative to the geographic spread of wildlife habitats: coordinated management among landowners was difficult due to high transaction costs so that wildlife had tended to be treated as an open-access resource; this led to the assertion of control by state authorities over private actions that were decimating wildlife stocks • Public landownership: maintain or convert the land to public ownership, and then designate a public agency to manage the wildlife resources (Table 18-1, page 362)
2. Sport/Recreational Hunting • The greater part of the value of hunting may stem from the satisfaction derived from engaging in the activity rather than in the number of wildlife harvested • Table 18-2, page 363 • In 2001, there were 37.8 million participants in hunting and fishing; the most popular activity was freshwater fishing, followed by big game hunting; total expenditures on fishing and hunting were $70.0 billion • Total participants in animal watching were 66.1 million, with $38.4 billion of expenditures
http://www.cbsnews.com/video/watch/?id=7411224n • To control hunting effort • Closed seasons: the hope behind limiting the length of a hunting season is that the number of hunting days will be reduced • In many places public authorities use lotteries to control hunting effort (Maine has a lottery to distribute moose hunting permits) • Publicly enforced bag limits: a limitation on the number of wildlife that may be taken per trip or per year • Private ownership: privately provided hunting has become popular in the U.S. and elsewhere; private landowners charge hunters for access to resident stocks of wildlife
3. Wildlife in Suburban Areas • Suburbanization is the growth of areas on the fringes of major cities; this brings people into contact with the wildlife that were living on the suburban fringe • Figure 18-6, panel (b), page 368 • On the basis of the marginal benefits and marginal costs curves indicate, the efficient animal population size is k* • MB (or MWTP) summarizes people’s attitude about wildlife. They place a high initial value and then the value of a marginal animal declines. This value is based on existence value, hunting value, or viewing value • MC shows the social costs of this stock of wildlife: the animals bring about changes in the ecosystem (beaver dams change surface water system); health costs such as threats of Lyme disease from tick-carrying deer; collisions between animals and automobiles; physical threats to pets and children; damage to agricultural crops…
4. Distribution Issues in Restoration • Diffuse benefits, concentrated costs: In Minnesota the reestablishment of the gray wolf confers benefits on a widely dispersed group of people, both inside and outside of the state. But it leads to substantial costs for a relatively small group—ranchers and farmers who experience depredation of their domestic livestock • Figure 18-7, page 371: • MWTPL: aggregate MWTP by locals; MWTPN: aggregate MWTP by nonlocals • MCL: aggregate marginal costs by locals; MCN: aggregate marginal costs by nonlocals; they are equal
Figure 18-7, page 371 (con’t): • Efficient stock levels are different for locals and nonlocals: s2 and s1 • In Alaska, state officials planned a wolf control project to reduce depredation of the state elk herds in accordance with MWTPL and MCL curves, with little recognition that there might be a MWTPN curve representing the values of people in the rest of the country for the existence of wolves in Alaska. The Alaskan authorities were forced by the nonlocal group to develop new plans • Table 18-3, page 373: mean WTP of supporters; total WTP of supporters; actual WTP is 28.6% of stated WTP
5. Public Policy and Wildlife Markets • Several decades ago, African elephant and black rhinoceros were wildly hunted for elephant ivory and rhino horn; the bans on rhino horn and elephant ivory were then carried out (1977 and 1989), but the rhino horn ban has been a disaster while the ivory ban has been successful. Why? • Figure 18-8, page 374: • Two S curves: before and after the ban (costs of getting caught and punished shift S up); two D curves: D1—before the ban; D2—after the ban • The major difference between the two markets is the slopes of D curves: D for ivory is flat since there are good substitutes of ivory to make piano keys, increased prices lead to big decreases in quantity demanded; D for rhino horn is steep since there are no ready substitutes for medical recipes, increased prices do not lead to big decreases in quantity demanded