Download
1 / 30
320 likes | 559 Vues
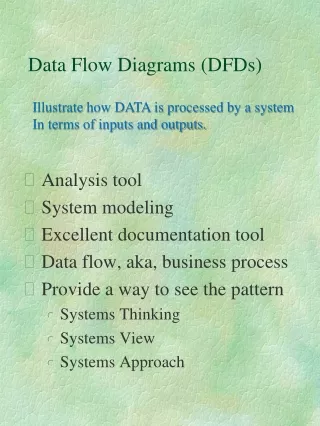
Data Flow Diagrams - Part 2 Hierarchical DFDs. Temporary Data store. Can use T to indicate a temporary data store usually manual eg in tray, where orders are placed before filing. T1. Hierarchical DFDs. DFDs are hierarchical Top-down stepwise refinement is employed

E N D
Temporary Data store • Can use T to indicate a • temporary data store • usually manual • eg in tray, where orders are • placed before filing T1
Hierarchical DFDs • DFDs are hierarchical • Top-down stepwise refinement is employed • Processes are expanded into sub-processes to show more and more detail • Each expansion is a new level • Highest level is level 0 aka a CONTEXT DIAGRAM • Lower levels are numbered 1,2,3 etc, • No limit to the number of levels allowed, but level 3 is usually enough
Components of a Data Flow Model Level 0Level 1 Entity 1 Process 2 Overall process Process 3 Entity Process
Components of a Data Flow Model Level 0 Level 1 Level 2 2 Entity 1 2.1 sub Process Process 2 2.2 Overall process sub Process Process 3 2.3 sub Process Entity Process
Components of a Data Flow Model Level 0 Level 1 Level 2 Level 3 2 2.2 Entity 1 2.1 2.2.1 sub Process sub-sub Process Process 2 2.2 2.2.2 Overall process sub Process sub-sub Process Process 3 2.3 2.2.3 sub Process sub-sub Process Entity Process
Components of a Data Flow Model Level 0 Level 1 Level 2 Level 3 Level 4 2 2.2 2.2.2 Entity 1 2.1 2.2.1 sub Process sub-sub Process Process 2 2.2 2.2.2 Overall process sub Process sub-sub Process Process 3 2.3 2.2.3 sub Process sub-sub Process Entity Process
Level 0 DFDs - Context Diagrams • Level 0 DFDs, aka Context diagrams are the highest level DFD, but not always required or drawn • Level 0 DFDs depict the system as a single process • Since there is only one process, there is no need to number the process
Level 0 DFDs – Context Diagrams • The process description at Level 0 gives an overview of the system i.e. the activities on the Level 1 DFD • Level 0 diagrams do not show Data stores • External entities should be shown and referenced
Example Context Diagram b a Accounts Customer Goods received Copy delivery note note Delivery note Weekly credit Re-order card Order limit list Order acknowledgement Sales, Despatch & Warehouse Goods received note c Supplier
GOODS RECEIVED NOTE (GRN) • A document produced when goods are received into the factory. It will usually accompany goods to any inspection and is used to check against invoices before payment..
delivery note • Definition • Document accompanying a shipment of goods that lists the description, grade, and quantity of the goods delivered. A copy of the delivery note, signed by the buyer or consignee, is returned to the seller or consignor as a proof of delivery.
Level 1 DFDs • First real DFD, i.e. always included • Show processes, external entities, data stores physical resources if required • Number all processes 1,2,3 etc • External entities must have the same references as Level 0 (if it was drawn)
Example - Level 1 DFD a b b c
Level 2 DFDs • If a process cannot be expanded any further, put an asterisk in the lower right hand corner *
Example - Level 2 DFD • In our example, just process 3 Stock control can be expanded to a Level 2 diagram • In the Level 2 diagram, the Stock control process is broken down into 4 sub-processes • Processes are numbered 3.1, 3.2, 3.3 etc • Process 3 has a Data store, called Stock, which was not present at Level 1, so its ID is M3/1, the first data store within process 3
Level 3 DFDs • Notice, from our Level 2 DFD, sub process 3.3 does not have an asterisk, so it can be expanded further ...
Level 3 DFDs • Note processes are now numbered 3.3.1, 3.3.2 etc • New data store has the ID M3.3/1 • All these Level 3 sub processes cannot be expanded further • You will not be asked to go beyond Level 2 in this Module
GoodPractise • Level 0 diagram shows the whole system as just one process • Level 1 diagram has one process for each department • Level 2 shows what happens within each department • Level 3 could show processes performed by a single named job role – eg warehouse supervisor • This is not always possible, but is very effective when it can be done
Drawing DFD Tips • Identify data flows, data stores and processes, as described in the last lecture • Draw processes first, down the centre of the page • Add external entities down the left hand side • Draw data stores down the right hand side • Finally add the data flows • Flow lines should not cross, use duplicate symbols to avoid crossing lines and keep DFD neat and tidy ...
Multiple Instances on a Single DFD For each instance of the duplicate element, add a line to the symbol, like so … Use duplicates to keep your DFD clear and easy to follow.
Duplicate Processes • Is possible, but should be avoided • ie duplicate external entities and data stores • Don’t duplicate Processes, unless you really have to • Duplicated processes complicate DFDs • Which defeats the objective
Drawing DFDs in this way encourages a step-by-step approach, that should result in diagrams which are better laid out and are easier to read. You need to know the terminology and conventions for exams. Practice interpreting case studies and drawing the DFDs. Read through the examples in Lejk and Deeks.
Drawing DFDs in this way encourages a step-by-step approach, that should result in diagrams which are better laid out and are easier to read. • You need to know the terminology and conventions for exams. Practice interpreting case studies and drawing the DFDs. • Read through the examples in Lejk and Deeks.
Rules for drawing DFDs Processes: • No process can have only output • No process can have only input • If you think a process has only input or output, then it must be an external entity (source/sink) • A process name must contain a verb
Rules for drawing DFDs Data Stores: • Data cannot move directly from one data store to another data store - data must be moved by a Process • Data cannot move directly from an external entity to a data store or vice versa - data must be moved by a process • The name of a data store must contain a noun
Rules for drawing DFDs External Entities: • Data cannotmove directly from one external entity to another. It must be moved by a process, otherwise don’t show the data flow on the diagram • The external entity name must contain a noun
Rules for drawing DFDs Data flow: • A data flow has only one direction of flow between symbols. It may flow in both directions, but these are usually shown as 2 separate arrows since they happen at different times • A data flow cannot go directly back to the same process it leaves • A data flow to a data store means update (append, delete or change) • A data flow from a data store means retrieve or use • A data flow label will contain a noun