Download
1 / 47
1.03k likes | 2.09k Vues
Thermal Remote Sensing. Introduction and Fundamentals. Airborne thermal image of warm creek flowing into ocean near Anchorage, AK. Thermal Remote Sensing. Thermal sensors can measure the amount of long wave IR that is “upwelling” from the surface

E N D
Thermal Remote Sensing Introduction and Fundamentals
Airborne thermal image of warm creek flowing into ocean near Anchorage, AK
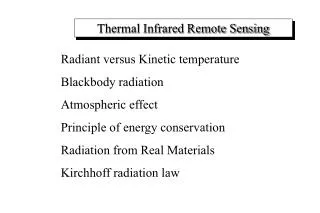
Thermal Remote Sensing • Thermal sensors can measure the amount of long wave IR that is “upwelling” from the surface • Different materials give off (emit) thermal radiation in different proportions (depends on emissivity) • Thermal can operate day or night (thermal lag) • Objects that are warm or cold relative to their surroundings stand out in thermal imagery
Thermal = Emitted Infrared • IR = 0.76 um to 1000 um • Reflective IR = 0.7 – 3.0 um (NIR and SWIR) • Thermal IR for remote sensing = 7 – 18 um (FIR) • IR beyond 18 um is not used for thermal remote sensing • Experiences almost no atmospheric scattering • But…lots of absorption by atmospheric gases (e.g., CO2) • Must use atmospheric windows for remote sensing • Reason for the “greenhouse effect”
The infrared portion of the electromagnetic spectrum Emitted Thermal
The Greenhouse Effect Univ. of Maryland
Satellites that capture thermal IR • Many satellites have thermal IR bands • Landsat TM and ETM+ (1 thermal band), and Landsat 8 (2 thermal bands) • MODIS (multiple thermal bands) • ASTER (multiple thermal bands) • CBERS (1 thermal band) • Thermal bands usually lower spatial resolution than optical bands due to low total thermal energy • Some sensors are devoted to thermal remote sensing and collect several thermal bands simultaneously • TIMS – JPL instrument
Thermal Properties of Objects • All objects with temperature > 0o K emit thermal radiation • Amount of radiation and peak wavelength emitted depend on temperature (Stefan-Boltzman Law and Wien’s Displacement Law) and emissivity • Hotter objects emit more thermal radiation for a given emissivity • Objects absorb radiation and then emit it based on their emissivities
Emissivity • Emissivity (ε) is measure of ability of a material to absorb and re-emit EMR • Emissivity is the ratio of the emittance of an object to that of a Black Body • A black body has ε = 1 (Absorbs and re-emits all radiation that hits it) • A white body has ε = 0 (Reflects all radiation that hits it) • Water has emissivity close to 1 • Most vegetation has ε close to 1 (because mostly water) • Many minerals have ε << 1 • Can find tables of emissivity in reference books and textbooks
Kinetic Temperature vs. Radiant Temperature • Kinetic temperature is caused by the vibration of molecules • sometimes called “true temperature” • measured using conventional temperature scales (e.g. oF, oC, oK) • Radiant temperature is the emitted energy of an object • sometimes called “apparent temperature” • what we measure with a thermal scanner in remote sensing • depends on emissivity
Thermal Remote Sensing • Incoming radiation from the sun is absorbed and re-emitted from objects • Objects vary in the amount of sun they “see” (different slopes, etc.) and in their emissivity • Thermal remote sensing is really the science of mapping differences in emissivity!
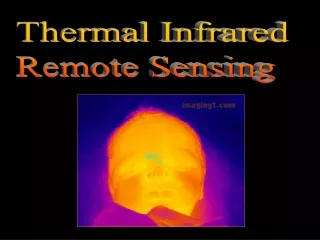
Interpreting Thermal Images • Thermal images (single band) typically look like black and white photographs • Bright areas = relatively warmer places • Dark areas = relatively cooler places • Weather (cloud) imagery is the opposite • To interpret, you need to know the time of day the image was acquired – day vs. night alters the interpretation because of different thermal lags among materials
Atlanta -- Daytime Atlanta -- Nighttime
Thermal lag • Because different materials cool at different rates, can use temporal change in thermal emission as a diagnostic tool • Plot thermal emission over time to create “thermal profiles” and interpret them like you would interpret spectral profiles • Useful in geology/mineralogy
Positive vs. negative • You must also know whether an image is a positive or a negative • Harder to tell with thermal imagery than with regular photos.
North Thermal Infrared Multispectral Scanner (TIMS) image of Death Valley Daytime Positive – Bright = warm, Dark = cool
Complicating factors for interpretation • Topography (effects amount of incoming radiation from sun) • Fine scale differences in emissivities of materials in scene • Cloud cover history • Precipitation history – differences in soil moisture • Vegetation canopy geometry • Geothermal areas • Many others
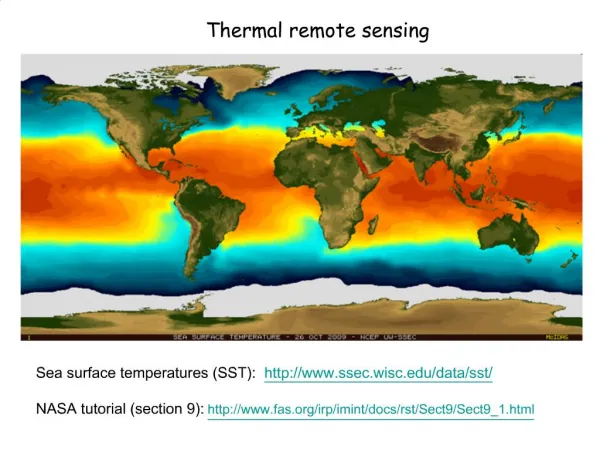
Applications • Agricultural water stress (energy balance) • Heat loss from urban areas • Mapping materials that have different emissivities (e.g. minerals) • Mapping moisture amounts • Ocean current mapping • Defense (camouflage detection, etc.) • Night vision • Plumes of warm water from power plants, etc. • Atmospheric studies, weather forecasting, etc.
Wyoming Water • Wyoming has several important rivers that flow to both sides of the Divide • Green River (Flows into the Colorado) • N. Platte • Bighorn • Snake (Flows into the Columbia) • Great Salt Lake (Water information and several figures on following slides are from James Jacobs and Donald Brosz, UW and WRDS) Flow into Missouri/Mississippi
Wyoming Water (cont.) • About 16.3 million acre feet of water falls on Wyoming each year as precipitation • About 1.9 million acre feet flow into the state each year • Together this = 18.2 million acre feet of surface water • Wyoming can legally consume 6.4 million acre feet of this each year • But…Wyoming must also supply contractual amounts of water to downstream states
Consumptive water use Consumptive water use is “the quantity of water evaporated, transpired, and/or incorporated into the products produced in connection with vegetative growth, food and industrial processing, and municipal use.” Irrigation is largest consumptive use in Wyoming (2.3 million acre feet per year) 80 – 85% of Wyoming’s consumptive use
Water Rights • In-state • Wyoming Constitution declares that surface water in Wyoming is property of the State (but interstate compacts limit this) • Water management overseen by the State Engineer’s Office (SEO) and the Board of Control (includes SEO and superintendents of State administrative water divisions • Interstate • Wyoming has interstate water compacts with other states by agreement or court decree • International • Green R. flows into Colorado which flows to Mexico
Interstate Compacts • Wyoming has agreements with Colorado, Nebraska, Idaho, and Montana concerning flows from specific streams and rivers
Problem: Drought • Drought results in less water flowing from Wyoming to downstream states • Drought is historically common in Wyoming • Drought may become chronic with climate changes • Law suits filed to try to require Wyoming to provide more water • Wyoming needs to show that the lost water is not Wyoming consumptive use • Must accurately estimate consumptive use for important watersheds (e.g., Upper Green River, Powder, N. Platte) • Requires information on irrigation, evaporationand transpiration
April 2007 • Montana Sues Wyoming to Protect Compact-Related Water Rights • State of Montana v. State of Wyoming and State of North Dakota, U.S. Supreme Court Under pressure from an eight-year drought, changing water uses, and increased groundwater pumping, the dispute resolution provisions of a nearly 60-year old interstate water compact have apparently failed.
Using remote sensing to estimate consumptive use • Remote sensing and GIS are critical tools for estimating consumptive water use in irrigated lands • Two general approaches • Map irrigated agriculture using satellite data or air photos and apply crop use coefficients to make spatial estimates • Use energy balance approach with thermal RS to directly estimate the amount of evaporation/transpiration • Combine with known inflow and runoff rates and can get consumptive use estimates
MODELINGET for Water Budgets - The Old Way Aquifer Rechargefor Each Model Cellrecharge = diversion + precipitation - ET Potential ET = acres * crop percentage * crop coefficient For each crop type Water Rights
Can see variable yield rates (and variable water use) by noting different tones in center pivots
Fate of irrigation water • What happens to irrigation water? • Flows onto a field or pasture (can measure amount with surface gauging) • Is used by plants (transpiration) or evaporated from ditches and soil (evaporation) • Unused water flows back into streams (can measure with surface gauging) • How do you measure transpiration/evaporation • In situ (surface) measurement • Solving the energy balance (it takes energy to evaporate water)
The energy balance approach • If you can calculate how much energy is being used to evaporate water, you can calculate the amount of water being evaporated • Energy all comes from the sun • Allows us to measure ACTUAL evapotranspiration (AET) vs. some theoretical amount of ET based on crop coefficients
WATER ADMINISTRATIONAgricultural Water Use Actual – Not Potential - ET
Energy Balance Equation • Simple equation captures the energy balance concept Q = R + H + LE + G Where Q = total incoming radiation (from sun) R = reflected shortwave light H = Sensible heat (long wave IR) LE = Latent heat (energy used to evaporate water) G = Stored heat (mostly in soil)
R - R
Annual Actual ET for Imperial Valley, California Modeled with SEBAL
Summary – Thermal Remote Sensing • Typically used to map surface materials that differ in thermal properties (like emissivity) • Usually NOT used to map absolute kinetic temperature • Many applications but not especially good for distinguishing among vegetation types because all veg has about the same emissivity • Gives us another tool to help distinguish materials that may be spectrally similar in the reflected wavelengths!