Download
1 / 24
250 likes | 422 Vues
Detailed Placement for Improved Depth of Focus and CD Control. Puneet Gupta 1 Andrew B. Kahng 1,2 Chul-Hong Park 2 (chpark@vlsicad.ucsd.edu). http://vlsicad.ucsd.edu. 1 Blaze DFM, Inc. 2 ECE Department, University of California, San Diego. Outline. OPC and SRAF: An Introduction

E N D
Detailed Placement for Improved Depth of Focus and CD Control Puneet Gupta1 Andrew B. Kahng1,2 Chul-Hong Park2 (chpark@vlsicad.ucsd.edu) http://vlsicad.ucsd.edu 1 Blaze DFM, Inc. 2 ECE Department, University of California, San Diego
Outline • OPC and SRAF: An Introduction • The AFCorr Methodology • AFCorr Placement Perturbation • Experiments and Results • Summary
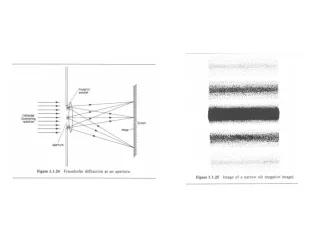
C.-H. Park et al., SPIE 2000 Before OPC After OPC OPC (Optical Proximity Correction) • Gate CD control is extremely difficult to achieve • Min feature size outpaces introduction of new hardware solutions • OPC = one of available reticle enhancement techniques (RET) to improve pattern resolution • Proactive distortion of photomask shape compensate CD inaccuracies
0.22 0.2 0.18 0.16 0.14 CD 0.12 0.1 0.08 DOF 0.06 0.04 0.0 0.1 0.2 0.3 0.4 0.5 0.6 SB2 SB0 SB1 SRAF (Sub-Resolution AF) Process Margin Layout (or Mask ) Design SB=0 Active SB=1 SB=2 Wafer structure (SEM) • SRAFs enhance process window (focus, exposure dose) • Extremely narrow lines do not print on water • Compensate deficiencies of OPC #SB = 0 #SB=1 #SB=2 CD (nm) 160 177 182
Bias OPC SRAF OPC SRAFs and Bossung Plots • Bossung plot • Measurement to evaluate lithographic performance at various exposure levels • Horizontal axis: Depth of Focus (DOF); Vertical axis: CD • SRAF OPC • Improves process margin of isolated pattern • Larger overlap of process window between dense and isolated lines
Outline • OPC and SRAF: An Introduction • The AFCorr Methodology • AFCorr Placement Perturbation • Experiments and Results • Summary
#SB=2 #SB=3 #SB=4 #SB=1 Allowable Forbidden Forbidden Pitches • Forbidden pitch lowers printability, DOF margin and exposure margin • Typically based on tolerance of +/- 10% of CD • Must avoid forbidden pitches in layout
Layout Composability for SRAFs Better than x+dx x • Small set of allowed feature spacings • Two components of SRAF-aware methodology • Assist-correct libraries • Inter-device spacing within a standard cells • Intelligent library design • Assist-correct placement THIS WORK • Intelligent whitespace adjustment between cells
Outline • OPC and SRAF: An Introduction • The AFCorr Methodology • AFCorr Placement Perturbation • Experiments and Results • Summary
AFCorr: SRAF-Correct Placement • By adjusting whitespace, additional SRAFs can be inserted between cells • Resist image improves after assist-aware placement adjustment • Problem: Perturb given placement minimally to achieve as much SRAF insertion as possible Before AFCorr After AFCorr Forbidden pitch Cell boundary
Minimum Perturbation Approach • Objective: • Minimum perturbation of input placement • Reduce weighted CD degradation with defocus • Preserve timing • Constraint: • Placement sitemap must be respected • How: • One cell row at a time • Solve each cell row by dynamic programming
Feasible Placement Perturbations SaLP Minimize | di | s.t. da-1+da +Sa-1RP + SaLP + (xa– xa-1– wa-1) AF Sa-1RP xa-1 xa Wa-1 wi and xi = width and location of Ci i= perturbation of location of cell Ci AF = set of allowed spacings RP, LP = boundary poly shapes with overlapping y-spans - Overlap types: g-g, g-f, f-f S = spacing from boundary poly to cell border
Dynamic Programming Solution COST (1,b) = | x1-b| // subrow up through cell 1, location b COST (a,b) = l(a) |(xa -b)| + MIN{Xa-SRCH ≤ i ≤ Xa+SRCH} [COST(xa-1,i) + HCost(a,b,a-1,i)] // SRCH = maximum allowed perturbation of cell location HCost = “forbidden-pitch cost” = sum over horiz-adjacencies of [slope(j) |HSpace –AFj| * overlap_weight] s.t. AFj+1 > HSpace AFj • l = weighted objective function • E.g., to account for timing-criticality of cells • Slope = CD / Pitch = CD degradation per unit space between AF values • AFi = closest assist-feasible spacing ≤ HSpace • Overlap_weight = overlap length weighted by relative importance of printability for gate-to-gate, gate-to-field, and field-to-field
Outline • OPC and SRAF: An Introduction • The AFCorr Methodology • AFCorr Placement Perturbation • Experiments and Results • Summary
Lithography model generation (Best & Worst DOF) Benchmark design Placement Post-Placement Forbidden pitch Route Route Assist Corrected GDS Experiments Typical GDS • Delay • # SB • # EPE • # Forbidden pitch • GDSII size • OPC Running Time SB OPC OPCed GDSs • SB Insertion • Model-based OPC • (Best DOF model) Experimental Flow
Experimental Setup • KLA-Tencor’s Prolith • Model generation for OPCpro • Best focus/ worst (0.5 micron) defocus • Calculating forbidden pitches • Mentor’s OPCpro, SBar SVRF • OPC, SRAF insertion, OPC simulation • Cadence SOC Encounter • Placement • Synopsys Design Complier • Synthesis
Experimental Metrics • SB Count • Total number of scattering bars or SRAFs inserted in the design • Higher number of SRAFs implies less through-focus variation and is hence desirable • Forbidden Pitch Count • Number of border poly geometries estimated as having greater than 10% CD error through-focus • EPE Count • Number of edge fragments on border poly geometries having greater than 10% edge placement error at the worst defocus level
Results: Increased SB Count • SB count increases as utilization decreases due to increased whitespace • Better DOF and resist image
Results: Reduced F/P and EPE • Forbidden pitch count • 81%~100% in 130nm, 93%~100% in 90nm • EPE Count • 74%~95% in 130nm, 83%~96% in 90nm
Impact on Other Design Metrics • Data size 4%, OPC running time 3%, Cycle time 6% • Other impacts are negligible compared to large improvement in printability metrics
Outline • OPC and SRAF: An Introduction • Forbidden Pitch Extraction • The AFCorr Methodology • Experiments and Results • Summary
Summary • AFCorr is an effective approach to achieve assist feature compatibility • Up to 100% reduction of forbidden pitch and EPE • Relatively negligible impacts on GDSII size, OPC runtime, and design clock cycle time • Compared to huge improvement in printability • Ongoing research • Considering forbidden pitches of field poly of “vertically” adjacent cells • Developing “correct-by-construction" standard-cell layouts which are always AFCorrect in any placement
A Notation • W = cell width; • RP, LP = Boundary poly geometries • S = Spacing from boundary poly to cell border • O = Parallel adjacencies between poly features (g-f, g-g, f-f) • Example: Sa-1RP2 + (xa-1– xa– wa-1) + SaLP3 should be assist-correct