Download
1 / 15
150 likes | 277 Vues
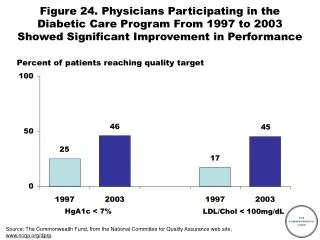
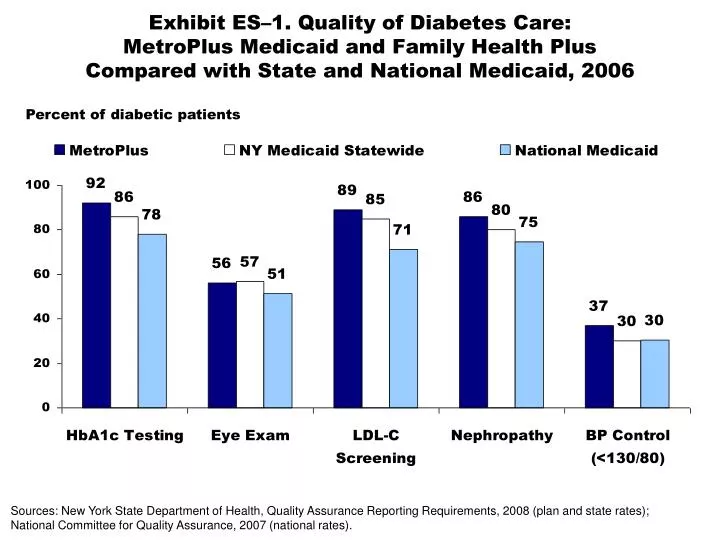
Exhibit ES–1. Quality of Diabetes Care: MetroPlus Medicaid and Family Health Plus Compared with State and National Medicaid, 2006. Percent of diabetic patients.

E N D
Exhibit ES–1. Quality of Diabetes Care: MetroPlus Medicaid and Family Health Plus Compared with State and National Medicaid, 2006 Percent of diabetic patients Sources: New York State Department of Health, Quality Assurance Reporting Requirements, 2008 (plan and state rates); National Committee for Quality Assurance, 2007 (national rates).
Exhibit ES–2. Hospital Quality Indicators: HHC Compared with New York City and National Averages, April 2006–March 2007 Percent of hospital patients receiving appropriate and timely treatment or prevention Source: New York City Health and Hospitals Corporation (HHC) analysis of CMS Hospital Compare data. Averages reflect eight measures for heart attack, four measures for heart failure, seven measures for pneumonia, and two measures for surgical infections.
Exhibit ES–3. MetroPlus Compared with New York City Medicaid Managed Care Plans: Average Ratings for Quality and Patient Satisfaction, 2007 Source: New York State Department of Health, 2007 Consumer Guide—Medicaid Managed Care in New York City.Ratings are based on a comparison of plan rates to statewide averages for 11 measures. Average rating calculated by case-study authors as the average of ratings for the 15 New York City plans.
Exhibit 1. New York City Health and Hospitals Corporation (HHC) Regional Networks Source: New York City Health and Hospitals Corporation.
Exhibit 2. Medication Ordering Errors:Two HHC Hospitals Before and After Implementationof Integrated Medication Management (IMM) Source: G. Almond, M. Barrameda, V. Bekker, et al. “Generations+/Northern Manhattan Health Network,” HIMSS Davies Organization Award Recipient Manuscript, 2006.
Exhibit 3. Quality of Diabetes Care: MetroPlus Medicaid and Family Health Plus Compared with State and National Medicaid, 2006 Percent of diabetic patients Sources: New York State Department of Health, Quality Assurance Reporting Requirements, 2008 (plan and state rates); National Committee for Quality Assurance, 2007 (national rates).
Exhibit 4. Asthma Hospital Admission Rates: MetroPlus Patients Receiving Care from HHC Providers, 2004–2007 Pediatric patients (percent) Adult patients (percent) Source: New York City Health and Hospitals Corporation.
Exhibit 5. Hospital Quality Indicators: HHC Compared with New York City and National Averages, April 2006–March 2007 Percent of hospital patients receiving appropriate and timely treatment or prevention Source: New York City Health and Hospitals Corporation (HHC) analysis of CMS Hospital Compare data. Averages reflect eight measures for heart attack, four measures for heart failure, seven measures for pneumonia, and two measures for surgical infections.
Exhibit 6. Hospital-Acquired Infection Ratesfor 11 HHC Intensive Care Units, 2005–2007 Rates per 1,000 device days Source: New York City Health and Hospitals Corporation.
Exhibit 7. Unreconciled Medications per 100 Admissions, October 2005–April 2006 Source: G. Almond, M. Barrameda, V. Bekker, et al. “Generations +/Northern Manhattan Health Network,” HIMSS Davies Organization Award Recipient Manuscript, 2006.
Exhibit 8. Hospital Mortality Rates of HHC Hospitals Compared with National and Northeastern Regional Averages, 2003–2007 Hospital mortality rates (percent) * Most recent data available. Source: New York City Health and Hospitals Corporation and New York State Department of Health.
Exhibit 9. MetroPlus Chronic Disease Pay-for-Performance Metrics for Asthma Source: A. Saperstein, Driving Quality Through Incentives in a Municipal Hospital System, Quality Colloquium, August 20, 2007. ER = emergency room; IP = inpatient.
Exhibit 10. Remote Simultaneous Medical Interpreting Source: New York University School of Medicine, Center for Immigrant Health, www.med.nyu.edu/cih/language/research.html.
Exhibit 11. Facilities Modernization at Bellevue Hospital Center: Ambulatory Care Pavilion and Critical Care Pavilion Source: New York City Health and Hospitals Corporation.
Exhibit 12. MetroPlus Compared with New York City Medicaid Managed Care Plans: Average Ratings for Quality and Patient Satisfaction, 2007 Source: New York State Department of Health, 2007 Consumer Guide – Medicaid Managed Care in New York City. Ratings are based on a comparison of plan rates to statewide averages for 11 measures. Average rating calculated by case-study authors as the average of ratings for the 15 New York City plans.