Download
1 / 13
130 likes | 222 Vues
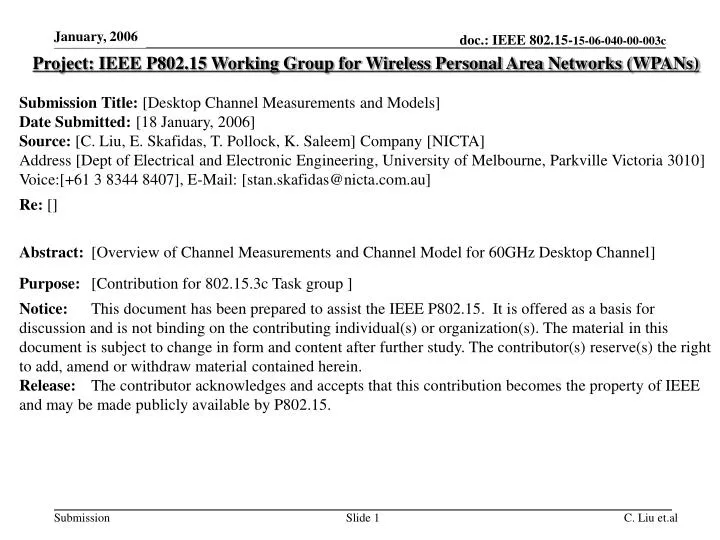
January, 2006. Project: IEEE P802.15 Working Group for Wireless Personal Area Networks (WPANs) Submission Title: [Desktop Channel Measurements and Models] Date Submitted: [18 January, 2006 ] Source: [C. Liu, E. Skafidas, T. Pollock, K. Saleem] Company [NICTA]

E N D
January, 2006 Project: IEEE P802.15 Working Group for Wireless Personal Area Networks (WPANs) Submission Title: [Desktop Channel Measurements and Models] Date Submitted: [18 January, 2006] Source: [C. Liu, E. Skafidas, T. Pollock, K. Saleem] Company [NICTA] Address [Dept of Electrical and Electronic Engineering, University of Melbourne, Parkville Victoria 3010] Voice:[+61 3 8344 8407], E-Mail: [stan.skafidas@nicta.com.au] Re: [] Abstract:[Overview of Channel Measurements and Channel Model for 60GHz Desktop Channel] Purpose:[Contribution for 802.15.3c Task group ] Notice: This document has been prepared to assist the IEEE P802.15. It is offered as a basis for discussion and is not binding on the contributing individual(s) or organization(s). The material in this document is subject to change in form and content after further study. The contributor(s) reserve(s) the right to add, amend or withdraw material contained herein. Release: The contributor acknowledges and accepts that this contribution becomes the property of IEEE and may be made publicly available by P802.15. C. Liu et.al
Introduction • Numerous desktop measurement made • Measurements were made at different times and location on the same and different desktops • The Saleh-Valenuela (S-V) model is used to model the desktop environment. • Key S-V model parameters such as Cluster Decay Factor, Ray Decay Factor, Cluster Arrival Rate, and Ray Arrival Rate are extracted from the measured data. C. Liu et.al
Measurement Setup • An Anritsu 37397 Vector Network Analyzer (VNA) was used to measure the channel transfer function. • The outputs of the amplifiers where connected to the antennas used in the experiment. • The two antennas were mounted on tracks and the directional receive antenna was attached to an electronically steerable platform that permitted the angle of the antenna to be precisely and automatically controlled • In this setup the VNA was set to sweep between 55-65GHz with a frequency step of 6.25MHz for 1601 data points. C. Liu et.al
Measurement Setup • An omni-directional antenna is employed at the transmitting side • A 21dBi directional pyramidal horn antenna at the receiving side. • The antennae voltage standing wave ratios were better than 1.5:1 over the entire frequency of interest. • The antennae were mounted on rails that permit the precise and automatic positioning required at 60 GHz (5mm wavelength). • For AoA measurements a directional antenna was mounted on an electronically steerable platform for precise angular measurements from 0 to 360 degrees in 4 degree steps. • For each angle the time impulse response was be measured. C. Liu et.al
Measurement Setup C. Liu et.al
Measurements C. Liu et.al
Measurements • Angle of Arrival Profile for the desktop pictured in Figure 1. • Note that signal is received in multiple angles in azimuth. C. Liu et.al
Measurements • Power delay profile measured at desk pictured in Figure 1. • Note the delay and relative reduction of power of the signal received at 308 degrees in azimuth. C. Liu et.al
Model • SV model • cluster arrival rate • ray arrival rate (within each cluster) • cluster decay factor • ray decay factor • cluster and ray log-normal standard deviation C. Liu et.al
Parameter Extraction • Normal probability plot of the log of the power amplitude of rays received within a cluster. C. Liu et.al
Parameter Extraction • Plot of log of Cluster Power versus time. • Gradient is equal to inverse of Cluster Decay factor. C. Liu et.al
Parameter Extraction • Plot of log of Ray Power versus time. • Gradient is equal to inverse of Ray Decay factor. C. Liu et.al
Extracted SV parameters • Parameters • cluster arrival rate 0.30 • ray arrival rate (within each cluster) 8.73 • cluster decay factor 1.47 • ray decay factor 1.00(dB), • cluster log-normal standard deviation 2.1 • ray log-normal standard deviation 2.4 C. Liu et.al