Download
1 / 121
1.21k likes | 1.36k Vues
Decennial Census A Base for Community Analysis. Grace York University of Michigan March 2007. Components of Your Assignment. Observation Analyzing Census and other statistical data and comparing with 5 th grade residence Community interviews. Outline of Presentation. Census Questionnaire

E N D
Decennial CensusA Base for Community Analysis Grace York University of Michigan March 2007
Components of Your Assignment • Observation • Analyzing Census and other statistical data and comparing with 5th grade residence • Community interviews
Outline of Presentation • Census Questionnaire • Census Geography • Map to Identify Your Neighborhoods • Census Data • Thematic Mapping • Other Data Sources on the Web
Class Bibliography http://www.lib.umich.edu/ govdocs/compsych.html
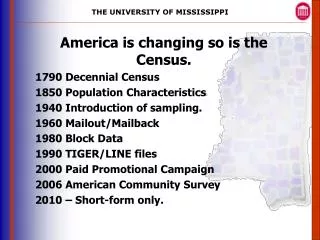
Purpose of the Census • Mandated by the Constitution • Reapportionment of 435 seats in the House of Representatives • Latest Census is 2000; updates do not provide neighborhood info
Two Questionnaires 100% Questionnaire Sent to all households SAMPLE Questionnaire Sent to one-sixth of households
2000 Questionnaire 100% Questionnaire • Age • Sex • Race (Multiple) • Hispanic origin • Household relationship • Occupied v. vacant housing units • Owner v. renter occupied housing
Primary Uses of Short Form Data • Race and sex for single years of age to 99; three groups after 100 • Most detail by race (250 groups total)
Race Groups in 2000 • White • Black or African-American • American Indian or Alaskan Native • Asian • Hawaiian or Pacific Islander • Other • Two or More (Based on Self-Identification)
Individual Races • Some files breakdown Asian, Pacific Islander, American Indians and Hispanic into 250 categories • Includes Chippewa Indians, Hmong, Pakistanis • Whites and blacks broken out as ancestry in sample data (e.g.Israelis, Arabs, Iranians, Nigerians) • Racial definitions appear at: http://www.lib.umich.edu/govdocs/census2/ sf3td/sf3tdg7.pdf
Hispanic Not considered a race Can be Hispanic and any race Breakdowns in some tables • Cuban • Puerto Rican • Mexican • Spanish • Various Latin American Countries
Calculating Minorities Replace White Alone with White Alone Non-Hispanic White Hispanic Then add Black Alone Native American Alone Asian Alone Hawaiian or Pacific Islander Alone Other Alone Two or More Races
New Race Category in 2000 Respondents could choose up to SIX racial backgrounds Typical mixed race is 2-3% of population Race data not necessarily comparable with previous censuses
Household Relationships Relationship to Householder • Spouse • Child • Stepchild • Grandchild • Brother/Sister • Parent • Non-relative • Unmarried partner is separate category
100% Questionnaire Data Reports Pre-Tabulated Data • Summary File 1 – most age, race, sex data to the smallest geographies, block and block group • Summary File 2 – same data by 250 races and Hispanic groups to neighborhood (tract) level
2000 Sample Questionnaire • Marital status, housing value and rent (100% in 1990) • Grandparents as caregivers (new) • Ancestry • Language • Country of origin • School enrollment and educational attainment (and dropouts)
2000 Sample Questionnaire • Employment • Industry and occupation • Transportation to and place of work • Disability and mental illness • Veteran status • Income and poverty
Sample Data Products Pre-Tabulated Data • Summary File 3 – socio-economic and housing characteristics to census tract or block group level • Summary File 4 – same data as Summary File 3 for 210 racial and 125 ethnic groups to tract level
Census Geography Legal Areas • Nation • State • Counties • Cities • Townships • Congressional Districts • School Districts
Census Geography Census-Designated Areas • Metropolitan Statistical Area • Urbanized Area • Census Tract • Block Group • Block • Zip Code Tabulation Area
Metropolitan Statistical Area • Central city of 50,000 or more • Its own county, and • Surrounding counties with • heavy commuting patterns
Detroit Consolidated Metropolitan Statistical Area 1990 Lapeer Livingston Detroit PMSA Macomb Monroe Oakland St. Clair Wayne Ann Arbor PMSA Washtenaw 2000 Lapeer Macomb Detroit PMSA Monroe Oakland St. Clair Wayne Lenawee Ann Arbor PMSA Livingston Washtenaw Flint PMSA Genesee
Census Tracts • Areas of about 4000 people • Approximate neighborhoods
Block Group Two – eight block groups per tract All 2000s (2001, 2002, 2003) are BG 2 Smallest area for sample data
Blocks All blocks in 2000 have 4-digit numbers Some 100% data but no sample data
Locating Census Maps • American Factfinder • http://factfinder.census.gov/ • Documents Center Paper Copies • Tract maps for Michigan • Block maps for Wayne and Washtenaw • Southwest Detroit Tract Map • http://www.lib.umich.edu/govdocs/images/detsw.GIF
Initial Factfinder Screen http://factfinder.census.gov/ (Mozilla works better than internet explorer for downloading) Skip Examples
Geographic Area If you know the geographic area or proceed directly toDATA SETS If you need to determine the geographic area, go toADDRESS SEARCH
Geographic Area Default is address search Name search is a place search
Address Searching Search for a known address to find its county, city, tract, block group, block number, and map
Address Searching Choose the Reference Map from your search results
Revised Map Move map around to choose block groups and census tracts in neighborhood.
Example of a Neighborhood Tract 5240; 5241-BG 2, and 5242-BG 1&2 (It is much easier to retrieve data if your neighborhood has whole tracts, e.g.5240, 5241, 5242)
Another Search Click on Geography to Change to Another Search
Place Name Searching BESToption for mapping • States • Counties • Cities • Townships • Villages
Altering Map Place boundaries in green. You may need to add census geographies on your own.
Reading Tract Numbers Sometimes you have to zoom in to read all of the tract numbers.
Making Map More Legible Fiddle with the legend to make more readable. Example: take out block groups; put in zip codes
Downloading Map Use Download command to download in pdf format Left click on mouse to download in gif format
Data Sets Once you’ve determined geography and go to DATA SETS for the detail
Listing of Data Sets The default display are files from the 2000 and 1990 Census
Data Files for 2000 • Summary File 1: 100% • Race, sex, age, households and families, housing tenure • BLOCK LEVEL for many categories • MOST DETAILED ON AGE • Summary File 2: 100% • Detailed cross classifications by type of Hispanic origin, Indian tribe, or Asian subcategory (about 250 total) • LOWEST LEVEL IS TRACT
Data Files for 2000 • Summary File 3: Sample • Income, language, ethnicity, occupation, commuting, housing value and rent for 7 races and Hispanic • Most useful file for most of you • Summary File 4: Sample • SF3 data with detailed cross classifications by for 350 races and ancestries (e.g. income for Mexican, Lebanese)
Summary File 3http://factfinder.census.gov/ The most interesting social and economic characteristics for the smallest geography.
Data Sets Option Box Options box aligns with checked data set Use Detailed Tables or Thematic Maps