Download
1 / 28
280 likes | 285 Vues
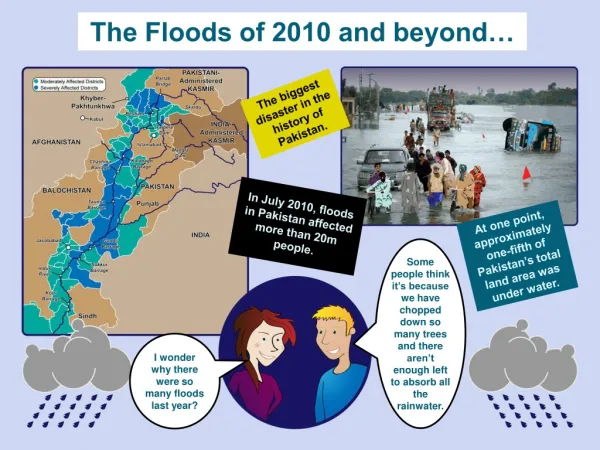
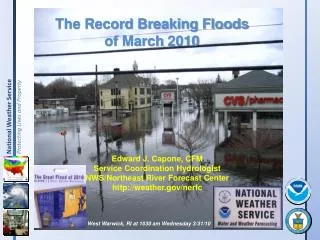
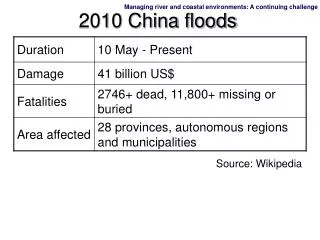
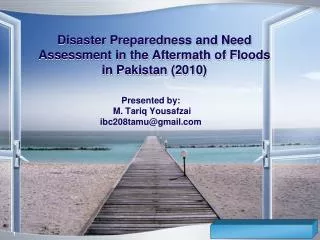
This analysis explores the significance of the Pakistan floods of 2010 and examines the potential for a similar catastrophe in America. It discusses the background of the floods, hydrology of the Indus River, similarities in U.S. watersheds, and the impact study. The article also highlights the planning factors, flood distribution, and historical peaks of the Indus River. Additionally, it examines Hazus modelled losses in selected U.S. communities.

E N D
Significance of the Pakistan Floods of 2010 to America Could it happen here? Michele Seib, CFM Zachary Baccala, CFM
Index of Analysis • Background of floods along Indus River • Hydrology of the Pakistan flood of 2010 • Similarities in U.S. Watersheds • Hazus Analysis of the Missouri River • Impact Study – Could a similar catastrophe happen here?
Background – Indus River Facts • Primary source of agricultural water supply • Provides 45% of electricity for Pakistan • Majority of populationlive in the watershed http://media-cdn.tripadvisor.com/media/photo-s/01/24/f8/5e/indus-river-and-fields.jpg obtained 5/15/2011 http://1.bp.blogspot.com/-2YKQLSdquC0/TaGEbBL0NfI/AAAAAAAAEbk/RUTiBuswuSU/s1600/Indus+River+Pakistan+by+all+about+pakistran+%252819%2529.jpg obtained 5/15/2011
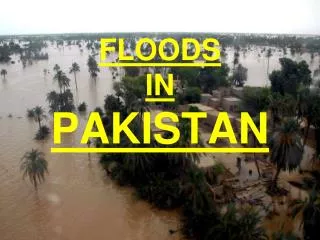
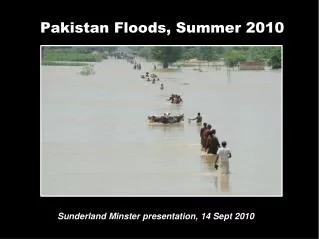
Background – 2010 Flood Facts According to the United Nations OCHA, • 17.2 million people directly affected • 1,539 lives claimed • 1.2 million homes damaged or destroyed • 3.2 million hectares of farmland destroyed • Damaged 7,820 schools • Massive infrastructure damage Photo of flooding in Muzaffargarh (AFP/Getty Images)
Background – Planning Factors Location of Development Lack of maintenance Flood warning system Lack of storage FLOODING http://www.floodrelief.us/wp-content/uploads/2010/08/pakistan-flood-2009-8-17-12-41-15.jpg obtained 05/15/2011
Background – Flood Distribution based on: http://www.spiegel.de/panorama/0,1518,711885,00.html, Google Earth and Times Atlas, flooding zones as of 2010-8-26
Hydrology – Indus River • Precipitation and temperature primary contributors • Links Himalayans and groundwater from Indus alluvium fans • Large number of dams and barrages • Total Drainage area = 450,000 square miles
Hydrology – Flood Disaster Factors Duration of monsoon season Lack of maintenance Higher than normal precipitation Design Criteria of structures http://www.inmysense.com/wp-content/uploads/2010/11/flood-pakistan.jpg
Hydrology – Indus River Tarbela Kalabaugh Taunsa Chashma Guddu Sukkur Kotri http://ancien.riob.org/ag2000/pakistan.htm
Hydrology – Historical Peaks Data obtain from the Pakistan Meteorology Department
Hydrology – Study Locations Tarbela Taunsa Guddu 65,000 sq miles 833,000 cfs 180,000 sq miles 959,991 cfs 293,300 sq miles 1,130,000 cfs
Similarities – US Watersheds • Missouri River Basin • Average discharge 86,340 cfs • 529,350 square miles • Sourced by several springs http://www.nwd-mr.usace.army.mil/rcc/images/mrr_map_1.jpg
Similarities – US Watersheds Fort Peck Dam, MT Sioux City, IA Bismark, ND Hermann, MO
Similarities – Gage Pairs Fort Peck Dam Montana 57,566 sq miles Q100 = 45,620 cfs Q500= 58,770 cfs Historical Peak= 51,000 cfs (1946) Tarbela 65,000 sq miles 833,000 cfs Bismark North Dakota 186,400 sq miles Q100 = 325,200 cfs Q500=548,500 cfs Historical Peak= 500,000 cfs (1952) Taunsa 180,000 sq miles 959,991 cfs Sioux City Iowa 314,600 sq miles Q100 = 445,600 cfs Q500=571,100 cfs Historical Peak= 441,000 cfs (1952) Guddu 293,300 sq miles 1,130,000cfs
Similarities – Gage Pair Hermann Missouri 573,566 sq miles Q100 = 703,900 cfs Q500= 862,100 cfs Historical Peak= 750,000 cfs (1993) Kotri *450,000 sq miles 964,000 cfs
Hydrologicallyspeaking, could an event happen along the Missouri River?
Hazus • Hazus MR5 • DEMs from USGS Seamless • DEMs for Canada from SRTM 90mtr data • Resampled to 30mtr • 20 sq mile drainage area used for stream network creation • Single Discharge Methodology • Section 1: 833,000 • Section 2: 959,991 • Section 3: 1,140,000
Hazus – Selected Communities • Bismarck, North Dakota • 1952 Floods • 27.9 feet, 200 homes destroyed • 300 head of cattle • Modeled Flood (Section 2) • 31 feet • 7,124 homes impacted • 3,788 substantially damage • $1,232,086,000 Total Loss • Mandan, ND also heavily impacted
Hazus – Selected Communities • Sioux City, Iowa • 1952 Floods • 24.3 feet • $3,264,000 in damages • Modeled Flood (Section 3) • 33 feet • 5,240 homes impacted • 3,246 substantially damage • $1,694,734,000 Total Loss • Dakota County, NE also heavily impacted
Hazus – Selected Communities • Omaha, Nebraska • 1952 Flood • 30.25 feet • $445,018,700 in damages • 414,000 cfs • 5 miles wide • Altered course of river • Modeled Flood (Section 3) • 33 feet • 9,463 homes impacted • 7,665 substantially damage • $2,742,164,000 Total Loss • Almost 7 miles wide • 1,140,000 cfs
Hazus Agricultural Analysis • Parameter and Losses • Agriculture Parameter: May 1st • Agricultural Losses Totaling $352,450,000 • Majority Corn, Soybeans, Wheat and Oats
Hazus • General Building Stock • $7,070,296,000 Total Losses • Shelters • Displaced Population: 106,845 • Short Term Needs: 93,088 • Schools • 59 schools • $216,594,290 Building Damage
Other Impacts • Transportation Systems • Airports • 4 large airports, including Eppley Airfield in Omaha, Nebraska and Sioux Gateway Airport (Colonel Bud Day Field) in Sioux City, Iowa • Roads • 235 Major Highway segments • 32 of Highway crossings • Rails • 1,085 miles inundated • 8 rail crossings
Environmental Hazards • Over 7500 Public Water Source wells • TRI Sites • 173 Sites • Agricultural, Fuel Depots, Industrial chemicals • Waste Water Treatment Facilities • Over 40 • 16 Classified as Major
Environmental Hazards • Over 7500 Public Water Source wells • TRI Sites • 173 Sites • Agricultural, Fuel Depots, Industrial chemicals • Waste Water Treatment Facilities • Over 40 • 16 Classified as Major
Could such an event happen in the US? • From an engineering perspective • Yes, but only at the mouth • From a economic perspective • Relief Aid • Income/Educational differences • Government Organizations • From a quality of life perspective
Questions • Michele Seib: michele.seib@atkinsglobal.com • Zachary Baccala: zachary.baccala@atkinsglobal.com