Download
1 / 21
230 likes | 526 Vues
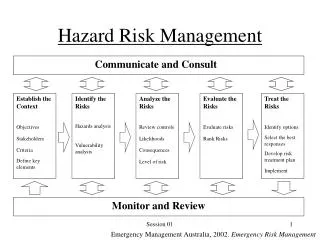
Overview of Flood Hazard Risk MAP Products. Northwest Florida Water Management District Wednesday, August 13 , 2014. Flood Risk Products Review. Risk MAP Mapping – Flood hazard and risk identification Assessment – HAZUS and other risk assessment tools Planning – Hazard mitigation planning

E N D
Overview of Flood Hazard Risk MAP Products Northwest Florida Water Management District Wednesday, August 13, 2014
Flood Risk Products Review • Risk MAP • Mapping – Flood hazard and risk identification • Assessment – HAZUS and other risk assessment tools • Planning – Hazard mitigation planning • Risk MAP Vision • Deliver quality data • Increase public awareness of flood risk • Encourage local/regional actions that reduce risk
Products Review (cont.) • Through Risk MAP, NWFWMD and FEMA work with communities to develop flood risk products and flood hazard maps that are: • Based on the best available data from the community and latest technologies • Conducted by watershed • Strengthened by partnerships • Risk MAP tools and data may be used to: • Create or improve Hazard Mitigation Plans • Make informed decisions about development, ordinances, and flood mitigation projects • Communicate with citizens about flood risk
Product Comparisons Non-Regulatory Products Traditional Regulatory Products DFIRM Database Traditional products are regulatory and subject to statutory due-process requirements Risk MAP products are non-regulatory and are not subject to statutory due-process requirements
Flood Risk Database (red= enhanced) • Changes Since Last FIRM • Horizontal Changes and Results • Structure/Population counts impacted by change • Depth & Analysis Grids • Depth (10, 04, 02, 01, 0.2 percent chance) • Percent Annual Chance • Percent 30-Year Grid • Delivery of Water Surface Elevation (multi-freq) • Water Surface Elevation Change Grid (1%) • Velocity Grids, Annualized Depth, Top and Toe of Levee • Multi Freq Grids for Levee and Coastal Areas, etc. • Flood Risk Assessment • Average Annualized Loss – 2010 • Refined Flood Risk Assessment • HAZUS or Non-HAZUS with improved data/assumptions • Areas of Mitigation Interest • Areas of Mitigation Opportunity or Awareness
Changes Since Last Map • Goals: • Help communities understand changes to their flood maps • Identify sources and areas of SFHA Increase/Decrease & Zone Changes • Produce a spatial layer that can be used to quickly identify building/structures that are at risk but were previously unidentified • Additional Value: • DFIRM QC tool • Identification of areas subject to appeal periods
New Mapping (w/ LiDAR) Previous Mapping Zone A Zone X Zone AE Zone X Waterloo
New Mapping
Changes Since Last FIRM Unchanged Unchanged SFHA Increase SFHA Increase SFHA Decrease Unchanged
Multi-Frequency Depth (& Other) Grids • Goals: • Help communities better understand their likelihood of flooding beyond just the “1 percent annual chance” floodplain • Produce data that can feed into HAZUS • Provide location-specific results within the floodplain that communities can leverage for additional analysis • Provide information that can feed into Benefit-Cost Analyses % Chance Over 30-yrs WSEL Depth % Annual Chance
Flood Depth Grids Depth Grid Calculated as Difference between WSE and Ground XS XS Depth
Multi-Frequency Depth Grids Point A Aerial Imagery Point C Point B
Multi-Frequency Depth Grids 1.8 ft 10% Depth 0.0 ft 0.0 ft
Multi-Frequency Depth Grids 3.5 ft 4% Depth 0.0 ft 0.4 ft
Multi-Frequency Depth Grids 4.4 ft 2% Depth 0.0 ft 1.4 ft
Multi-Frequency Depth Grids 5.4 ft 1% Depth 0.0 ft 2.3 ft
Multi-Frequency Depth Grids 0.2% Depth 9.7 ft 1.7 ft 6.6 ft
Percent Annual Chance of Flooding Grid 10% + % Annual Chance 0.4% 5%
Percent Annual Chance of Flooding over a 30-Year Period Grid 96% + % Chance Over 30-yrs 7% 78% Equation: 1 – (1-p)30
Risk MAP Products HAZUS Risk Assessment Enables communities to understand risk by reference to existing structure loss (HAZUS Average Annualized Loss (AAL) Study and updates)
Risk MAP Products Areas of Mitigation Interest Highlights areas of concern identified throughout the project.