Download
1 / 12
120 likes | 340 Vues
Visualization of Vector Fields From Sparse Observations of Oceanic Currents in the Western Gulf of Mexico. Presentation by Michael Darling Mentors: Dr. Steven Morey, Dr. Dmitry Dukhovskoy, Dr. James J. O’Brien Research Experience for Undergraduates in Computational Mathematics

E N D
Visualization of Vector Fields From Sparse Observations of Oceanic Currents in the Western Gulf of Mexico Presentation by Michael Darling Mentors: Dr. Steven Morey, Dr. Dmitry Dukhovskoy, Dr. James J. O’Brien Research Experience for Undergraduates in Computational Mathematics Florida State University, Center for Ocean-Atmospheric Prediction Studies
Abstract This project involves the development of a virtual reality visualization of ocean currents in the western Gulf of Mexico. A vector field will be created through the use of sparse data collection points at oil rigs off of the Louisiana shore. This was done through the use of various programming languages such as Matlab and the Virtual Reality Modeling Language (VRML) version 2.0, as well as numerical methods of solving differential equations.
Introduction • The National Data Buoy Center of the National Oceanic & Atmospheric Administration recently began receiving data from oil rigs in the western Gulf of Mexico. Approximately every ten minutes, a data file on the NDBC’s website is appended to show the real-time ocean current velocities at depths separated by 10-30 meters. Each data file, however, is dependent upon the way that a particular rig measures the data. Due to the vast separation of these rigs in the Gulf of Mexico, one cannot visualize the current flow in the Gulf without using a mathematical method to create a vector field.
Oil Rig Locations • The locations of the data stations can be seen here:
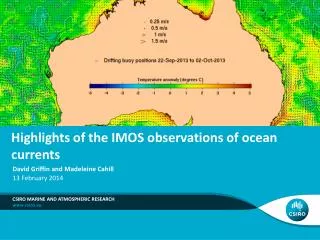
The Goal • From these data points, it is possible to create an accurate vector field in the areas that are heavily populated with oil rigs. The ultimate goal is to create an accurate mathematical representation of oceanic currents, which can be seen from this satellite photo: Chlorophyll concentrations in plankton among others show ocean currents through movement of chlorophyll with the current, shown in this color map from the Modis Satellite and the Colorado Center for Astrodynamics Research
Assumptions • Data collected at each rig is accurate. • Vectors do not enter areas of higher flow, such as tides.
Cortona The Cortona VRML Client from ParallelGraphics was used to view these visualizations. This browser plug-in, or a similar plug-in, is necessary to view VRML files. Above and Right: The Virtual Reality Visualization of ocean currents in the Western Gulf of Mexico represented by 3 Dimensional arrows in a vector field, shown from different angles.
Initially, the plan was to animate this plot of cones, but it was decided that VRML would be a better tool to use because of its 3D visualization features. This is a plot of the station locations and the velocities at the interpolated depths. Similar to the plot of cones above, at right is a VRML plot of 3D arrows to show oceanic currents at depths below each data station (oil rig). A plot of the ocean floor and the border of Louisiana serves as the background graphic.
The Final Visualization The velocity vectors have been scaled based on initial velocity, and are animated to show ocean currents. Above-left: The starting points of the vectors in the vector field. Above-right: Screenshot of the moving vectors from above. See computer presentation for vectors in motion. Color legend: Red: <200 meters. Green: 200-500 meters. White(blue): >500 meters.
Future Research • Modify the code to download the data from the NDBC website automatically and create an updated model to post on the web. • Use a different method of solving the differential equation, such as a 4th order Runge-Kutta method, or a predictor-corrector method.
References • -National Data Buoy Center. http://ndbc.noaa.gov • -Colorado Center for Astrodynamics Research. http://ccar.colorado.edu • -Sayers, Dr. Craig, Woods Hole Oceanographic Institution. VRMLPlot • Matlab Function, http://dsl.whoi.edu/DSL/sayers/VRMLplot/