Download
1 / 41
470 likes | 1.06k Vues
4.3 Vertical and Horizontal Translations. OBJ: Graph sine and cosine with vertical and horizontal translations. DEF: Vertical Translation. A function of the form y =c + a sin b x or of the form y = c + a cos b x is shifted vertically when compared with y = a sin b x or y =a cos b x.

E N D
4.3 Vertical and Horizontal Translations OBJ: Graph sine and cosine with vertical and horizontal translations
DEF: Vertical Translation A function of the form y =c + a sin b x or of the form y = c + a cos b x is shifted vertically when compared with y = a sin b x or y =a cos b x.
5 EX:Graph y = 2 – 2 sin x 0 ππ3π 2π 2 2
6 EX:Graph y = – 3 + 2 sin x 0 ππ3π 2π 2 2
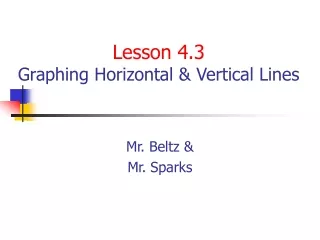
DEF:Phase Shift The function y=sin (x+d) has the shape of the basic sine graph y = sin x, but with a translation d units: to the right if d < 0 and to the left if d > 0. The number d is the phase shift of the graph. The cosine graph has the same function traits.
DEF:Period of Sine and Cosine The graph of y = sin b x will look like that of sin x, but with a period of 2 . b Also the graph of y = cos b x looks like that of y = cos x, but with a period of 2 b
y = c + a(trigb (x + d) a (amplitude) multiply a times (0 |1 0 -1 0 1) b (period) 2π b c (vertical shift) d (starting point)
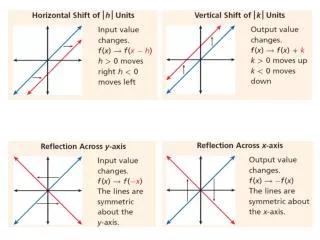
GRAPHING SINE AND COSINE FUNCTIONS In previous chapters you learned that the graph ofy=a•f (x–h) +k is related to the graph of y= |a| •f (x) by horizontal and vertical translations and by a reflection when a is negative. This also applies to sine, cosine, and tangent functions.
GRAPHING SINE AND COSINE FUNCTIONS TRANSFORMATIONS OF SINE AND COSINE GRAPHS To obtain the graph of y = a sin b(x – h) + k or y = a cos b(x – h) + k Transform the graph of y = | a | sin bx or y = | a | cos bx as follows.
GRAPHING SINE AND COSINE FUNCTIONS TRANSFORMATIONS OF SINE AND COSINE GRAPHS VERTICAL SHIFT Shift the graph k units vertically. k y=a•sinbx+k y=a•sinbx
GRAPHING SINE AND COSINE FUNCTIONS TRANSFORMATIONS OF SINE AND COSINE GRAPHS HORIZONTAL SHIFT Shift the graph h units Vertically. h y=a•sinb(x–h) y=a•sinbx
GRAPHING SINE AND COSINE FUNCTIONS TRANSFORMATIONS OF SINE AND COSINE GRAPHS y=a•sinbx+k REFLECTION If a < 0, reflect the graph in the line y = k after any vertical and horizontal shifts have been performed. y=–a•sinbx+k
Graphing a Vertical Translation Because the graph is a transformation of the graph of y = 3 sin 4x, the amplitude is 3 and the period is = . 2 2 4 3 8 4 2 8 Graph y = – 2 + 3 sin 4x. SOLUTION By comparing the given equationto the general equation y = a sin b(x – h) + k, you can see that h = 0, k= – 2, and a > 0. Therefore translate the graph of y = 3 sin 4xdown two units.
Graphing a Vertical Translation 3 3 8 8 4 4 2 2 8 8 y=– 2 Graph y = – 2 + 3 sin 4x. The graph oscillates 3 units up and down from its center line y=– 2. SOLUTION Therefore, the maximum value of the function is – 2 + 3= 1 and the minimum value of the function is– 2 – 3= –5
Graphing a Vertical Translation On y = k: (0, 2); , – 2 ; , – 2 4 2 Maximum: , 1 8 3 3 8 4 2 8 8 Minimum: , – 5 Graph y = – 2 + 3 sin 4x. SOLUTION The five key points are:
Graphing a Vertical Translation CHECK 3 8 4 2 8 Graph y = – 2 + 3 sin 4x. You can check your graph with a graphing calculator. Use theMaximum, Minimum and Intersect features to check the key points.
Graphing a Vertical Translation 2 Graph y = 2 cos x – . 3 4 Because the graph is a transformation of the graph ofy = 2 cosx, the amplitude is 2 and the period is = 3 . 2 3 2 2 3 SOLUTION
Graphing a Vertical Translation 2 π Graph y = 2 cos x – . 3 4 By comparing the given equation to the general equation y = a cos b(x–h) + k, you can see that h = , k = 0, and a > 0. 4 Therefore, translate the graph of y = 2 cos x right unit. 2 3 4 Notice that the maximum occurs unit to the right ofthe y-axis. 4 SOLUTION
Graphing a Horizontal Translation 2 Graph y = 2 cos x – . 3 4 1 On y = k: • 3+ , 0 = (, 0); 4 4 4 4 4 5 3 • 3+ , 0 = , 0 4 2 Maximum: 0 +, 2 = , 2 ; 4 13 3+, 2 = , 2 ; 4 1 7 Minimum: • 3+, – 2= , – 2 2 4 4 SOLUTION The five key points are:
Graphing a Reflection Graph y = – 3 sin x. Because the graph is a reflection of the graph of y = 3 sin x, the amplitude is 3 and the period is 2. SOLUTION When you plot the five points on the graph, note that the intercepts are the same as they are for the graph of y= 3 sin x.
Graphing a Reflection Graph y = – 3 sin x. SOLUTION However, when the graph is reflected in the x-axis, the maximum becomes a minimum and the minimum becomes a maximum.
Graphing a Reflection 1 • 2, 0 = (, 0) 2 1 Minimum:•2, – 3 = , – 3 2 4 3 3 Maximum: •2, 3 = , 3 2 4 Graph y = – 3 sin x. SOLUTION The five key points are: On y = k:(0, 0); (2, 0);
Modeling Circular Motion h = 25 sin t – 7.5 + 30 15 FERRIS WHEEL You are riding a Ferris wheel. Your height h (in feet) above the ground at any time t (in seconds) can be modeled by the following equation: The Ferris wheel turns for 135 seconds before it stops to let the first passengers off. Graph your height above the ground as a function of time. What are your minimum and maximum heights above the ground?
Modeling Circular Motion 2 The amplitude is 25 and the period is = 30. h = 25 sin t – 7.5 + 30 15 15 130 The wheel turns = 4.5 times in 135 seconds, so the graph shows 4.5 cycles. 30 SOLUTION
Modeling Circular Motion h = 25 sin t – 7.5 + 30 15 SOLUTION The key five points are (7.5, 30), (15, 55), (22.5, 30), (30, 5) and (37.5, 30).
Modeling Circular Motion h = 25 sin t – 7.5 + 30 15 SOLUTION Since the amplitude is 25 and the graph is shifted up 30units, the maximum height is 30+ 25 = 55 feet. The minimum height is 30– 25 = 5 feet.
TRANSFORMATIONS OF TANGENT GRAPHS To obtain the graph of y = atan b(x – h) + ktransform the graph of y= a tanbx as follows. | | GRAPHING TANGENT FUNCTIONS • Shift the graph k units vertically and h units horizontally. • Then, if a < 0, reflect the graph in the line y = k.
Combining a Translation and a Reflection Graph y = – 2 tan x + . 4 SOLUTION The graph is a transformation of the graph of y = 2 tan x, so the period is .
Combining a Translation and a Reflection Graph y = – 2 tan x + . 4 By comparing the given equation to y = a tan b(x– h) + k, you can see that h = – , k = 0, and a < 0. 4 Therefore translate the graph of y= 2 tan x left unit and then reflect it in the x-axis. 4 SOLUTION
Combining a Translation and a Reflection Graph y = – 2 tan x + . 4 3 x = – – = – ; x = – = 2•1 4 4 2•1 4 4 (h, k) = – , 0 4 – – , 2 = – , 2 ; – , – 2 = (0, – 2) 4•1 4 2 4•1 4 Asymptotes: On y = k: Halfway points: