Download
1 / 22
220 likes | 370 Vues
GMS Economic Cooperation Program and ASEAN Economic Community. PROSPECTS AND CHALLENGES for LMM. Suchat Katima Director, Mekong Institute (29 Nov 2012). Topics. Greater Mekong Subregion (GMS) The “Prosperity Gap”

E N D
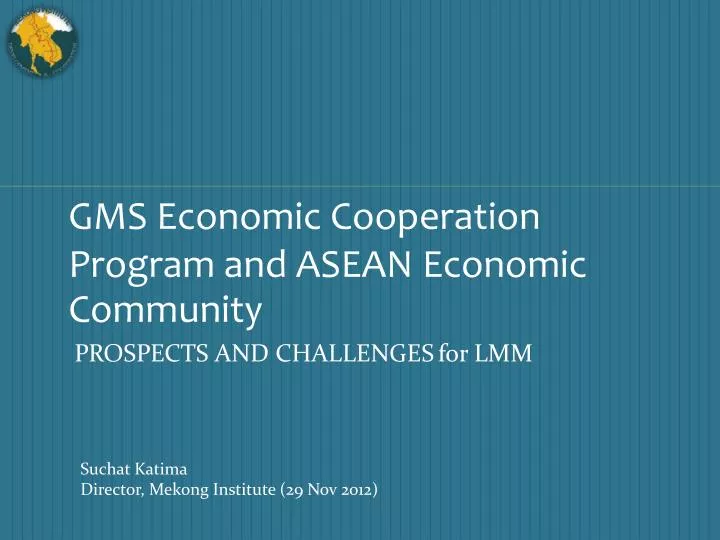
GMS Economic Cooperation Program and ASEAN Economic Community PROSPECTS AND CHALLENGESfor LMM Suchat Katima Director, Mekong Institute (29 Nov 2012)
Topics Greater Mekong Subregion (GMS) The “Prosperity Gap” Related Challenges in Achieving AEC 2015 Implications on Labor Migration Management
The GMS Economic Cooperation People’s Republic of China Land area: 633 thou sq km Population: 97.3 M GDP per capita: US$1,135 (figures for Yunnan and Guangxi only) Myanmar Land area: 677 thou sq km Population: 54.8 M GDP per capita: US$255 (2005) Viet Nam Land area: 332 thou sq km Population: 84.1 M GDP per capita: US$724 Thailand Land area: 513 thou sq km Population: 65.8 M GDP per capita: US$3,133 Lao PDR Land area: 237 thou sq km Population: 5.7 M GDP per capita: US$601 The GMS in 2006 Land area: 2.6 M sq km Population: 323 M GDP per capita: US$1,453* * excludes Myanmar Cambodia Land area: 181 thou sq km Population: 14.1 M GDP per capita: US$510
Infrastructure is developed in specific geographical areas based on economic potential. Usually starts with transport links, but extends to other infrastructure as well as the “software” for their optimal use.
Some Characteristics of Economic Corridors: 6 • Create links to major markets; • With nodal points – centers of enterprise development; • Extend the benefits of improved transport linkages to remote locations and integrates them with more prosperous areas; • Open up investment opportunities; • Promote synergies through the clustering of projects; • Provide demonstration effects.
Road Transport Network 2015 R3 a 228 km R3 b 253 km R 9 EWEC 246 3rd Bridge Nakhon Panom – Takek 4th Bridge – Chiang Kong - Hoisai
GMS Power Grid 1992 2004 2012 • Info. Super Highway Network Power Transmission Line Telecommunications Backbone
Interdependency of GMS Countries Available: Tin, Fisheries, Products Needs: Manganese, Iron • Resources: Available: Copper, Lead, Zinc, Tin, Iron, Hydropower Needs: Powdered Ores, Timber, Fisheries Products Available: Crude Oil, Gas, Coal, Apatite Needs: Steel, Refined Oil Available: Gas, Teak, Gemstone, Needs: Refined Oil, investment Available: Timber. Hydropower, Tin Needs: Fuel, investment Available: Tin, Rubber, HiTech, Rice Needs: Fuel, Labor Available: Timber, Fisheries, Product, Gemstone Needs: Fuel, investment
II. Diversity of GMS Source: IMF and National Bureau of Statistics of China *Data in 2008
II. Diversity of GMS (cont) Purchasing power in 2009: Source: IMF and National Bureau of Statistics of China *Data in 2008
“One Vision, One Identity, One Community” ASEAN GMS Countries - 2010 Land area: 1.94 M sq Km Population: 232 M ASEAN Countries - 2010 Land area: 4.48 M sq Km Population: 614 M
ASEAN Economic Community by Dec 31, 2015 • 0% tariff and reduction of non-tariff barriers • Single Production Base • Single Marketing Base • Free movement of investment, capital and services • Free movement of business people • Free movement of knowledge workers
Per Capita GDP – US$ Source:–AEC Chartbook 2010
Disparity bet. Rich & Poor Big Economy – Small Economy Coastal – Inland Urban – Rural Rich and Poor Have – Have not
Implications on LMM • Second Wave of Migrants • More landless labors • Limited SME ability to integrate into GVC • Cannot compete with modern SMEs • Limited Good Agricultural Practices (GAP) • Less economic self-sufficiency & less food security
Small and Medium Enterprises • Limited ability to integrate into ASEAN and global value chains
Agriculture • Limited absorptive capacity and adjustment of agriculture policies and practices to a larger and more competitive economy
What we need for the GMS • Modern farmers • Machine operators, mechanics, electricians, skilled factory workers, accredited vocational skills / MRA • Entrepreneurs • Services Providers (Hotel, food chains, tourism, logistics) • Clusters, Associations, Consortia
What we have • BA, MBA, political sciences, humanity • International Affairs • Languages (translators, interpreters) • employees, followers, contented low skilled workers • Loosely organized business association and Chamber of Commerce
Conclusion • Development gaps need to be addressed • Education and skills training must be based on current and anticipated needs • Minimum LMM standard and Mutual Recognition Arrangement must be in place and operational • Value chains integration of farmer associations and SMEs – a must