Parallel System Performance: Evaluation & Scalability
420 likes | 830 Vues
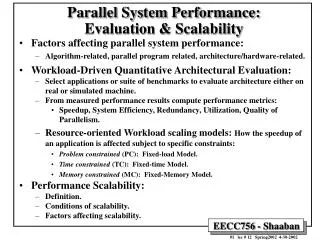
Parallel System Performance: Evaluation & Scalability. Factors affecting parallel system performance: Algorithm-related, parallel program related, architecture/hardware-related. Workload-Driven Quantitative Architectural Evaluation:

Parallel System Performance: Evaluation & Scalability
E N D
Presentation Transcript
Parallel System Performance: Evaluation & Scalability • Factors affecting parallel system performance: • Algorithm-related, parallel program related, architecture/hardware-related. • Workload-Driven Quantitative Architectural Evaluation: • Select applications or suite of benchmarks to evaluate architecture either on real or simulated machine. • From measured performance results compute performance metrics: • Speedup, System Efficiency, Redundancy, Utilization, Quality of Parallelism. • Resource-oriented Workload scaling models: How the speedup of an application is affected subject to specific constraints: • Problem constrained (PC): Fixed-load Model. • Time constrained (TC): Fixed-time Model. • Memory constrained (MC): Fixed-Memory Model. • Performance Scalability: • Definition. • Conditions of scalability. • Factors affecting scalability.
Sequential Work < Speedup = Max (Work + Synch Wait Time + Comm Cost + Extra Work) Time(1) Time(p) Parallel Program Performance • Parallel processing goal is to maximize speedup: • By: • Balancing computations on processors (every processor does the same amount of work). • Minimizing communication cost and other overheads associated with each step of parallel program creation and execution.
Factors affecting Parallel System Performance • Parallel Algorithm-related: • Available concurrency and profile, grain, uniformity, patterns. • Required communication/synchronization, uniformity and patterns. • Data size requirements. • Communication to computation ratio. • Parallel program related: • Programming model used. • Resulting data/code memory requirements, locality and working set characteristics. • Parallel task grain size. • Assignment: Dynamic or static. • Cost of communication/synchronization. • Hardware/Architecture related: • Total CPU computational power available. • Shared address space Vs. message passing. • Communication network characteristics. • Memory hierarchy properties.
Where ti is the total time that DOP = i and Parallel Performance Metrics Revisited • Degree of Parallelism (DOP): For a given time period, reflects the number of processors in a specific parallel computer actually executing a particular parallel program. • Average Parallelism: • Given maximum parallelism = m • n homogeneous processors • Computing capacity of a single processor D • Total amount of work (instructions or computations): or as a discrete summation The average parallelism A: In discrete form
Parallel Performance Metrics Revisited Asymptotic Speedup: Execution time with one processor Execution time with an infinite number of available processors Asymptotic speedup S¥ The above ignores all overheads.
Phase Parallel Model of An Application • Consider a sequential program of size s consisting of k computational phases C1 …. Ck where each phase Ci has a degree of parallelism DOP = i • Assume single processor execution time of phase Ci = T1(i) • Total single processor execution time = • Ignoring overheads, n processor execution time: • If all overheads are grouped as interaction Tinteract = Synch Time + Comm Cost and parallelism Tpar = Extra Work, as h(s, n) = Tinteract +Tpar then parallel execution time: • If k = n and fi is the fraction of sequential execution time with DOP =i p = {fi|i = 1, 2, …, n} and ignoring overheads the speedup is given by:
Harmonic Mean Speedup for n Execution Mode Multiprocessor system Fig 3.2 page 111 See handout
Parallel Performance Metrics Revisited: Amdahl’s Law • Harmonic Mean Speedup (i number of processors used): • In the case w = {fi for i = 1, 2, .. , n} = (a, 0, 0, …, 1-a), the system is running sequential code with probability a and utilizing n processors with probability (1-a) with other processor modes not utilized. Amdahl’s Law: S ® 1/a as n®¥ • Under these conditions the best speedup is upper-bounded by 1/a
Parallel Performance Metrics Revisited Efficiency, Utilization, Redundancy, Quality of Parallelism • System Efficiency: Let O(n) be the total number of unit operations performed by an n-processor system and T(n) be the execution time in unit time steps: • Speedup factor: S(n) = T(1) /T(n) • Ideal T(n) = T(1)/n -> Ideal speedup = n • System efficiency for an n-processor system: E(n) = S(n)/n = T(1)/[nT(n)] ideal = n /n = 1 • Redundancy: R(n) = O(n)/O(1) • Ideally with no overheads/extra work O(n) = O(1) -> R(n) = 1 • Utilization: U(n) = R(n)E(n) = O(n) /[nT(n)] • ideally R(n) = E(n) = U(n)= 1 • Quality of Parallelism: Q(n) = S(n) E(n) / R(n) = T3(1) /[nT2(n)O(n)] • Ideally Q(n) = 1
A Parallel Performance measures Example • O(1) = T(1) = n3 • O(n) = n3 + n2log2n T(n) = 4n3/(n+3) Fig 3.4 page 114 Table 3.1 page 115 See handout
Application Models of Parallel Computers • If work load W or problem size s is unchanged then: • The efficiency E decreases rapidly as the machine size n increases because the overhead h(s, n) increases faster than the machine size. • The condition of a scalable parallel computer solving a scalable parallel problems exists when: • A desired level of efficiency is maintained by increasing the machine size and problem size proportionally. • In the ideal case the workload curve is a linear function of n: (Linear scalability in problem size). • Application Workload Models for Parallel Computers: Bounded by limited memory, limited tolerance to interprocess communication (IPC) latency, or limited I/O bandwidth: • Fixed-load Model: Corresponds to a constant workload. • Fixed-time Model: Constant execution time. • Fixed-memory Model: Limited by the memory bound.
The Isoefficiency Concept • Workload w as a function of problem size s : w = w(s) • h total communication/other overhead , as a function of problem size s and machine size n, h = h(s,n) • Efficiency of a parallel algorithm implemented on a given parallel computer can be defined as: • Isoefficiency Function: E can be rewritten as: E = 1/(1 + h(s, n)/w(s)). To maintain a constant E, W(s) should grow in proportion to h(s,n) or, C = E/(1-E) is a constant for a fixed efficiency E. The isoefficiency function is defined as follows: If the workload w(s) grows as fast as fE(n) then a constant efficiency can be maintained for the algorithm-architecture combination.
Execution time of Wi Total execution time Problem Constrained (PC) Scaling : Fixed-Workload Speedup When DOP = i > n (n = number of processors) Fixed-load speedup factor is defined as the ratio of T(1) to T(n): Let h(s, n) be the total system overheads on an n-processor system: The overhead delay h(s,n) is both application- and machine-dependent and difficult to obtain in closed form.
Amdahl’s Law for Fixed-Load Speedup • For the special case where the system either operates in sequential mode (DOP = 1) or a perfect parallel mode (DOP = n), the Fixed-load speedup is simplified to: We assume here that the overhead factor h(s, n)= 0 For the normalized case where: The equation is reduced to the previously seen form of Amdahl’s Law:
Speedup is given by: Time Constrained (TC) Workload Scaling Fixed-Time Speedup • To run the largest problem size possible on a larger machine with about the same execution time.
Gustafson’s Fixed-Time Speedup • For the special fixed-time speedup case where DOP can either be 1 or n and assuming h(s,n) = 0
Memory Constrained (MC) ScalingFixed-Memory Speedup • Scale so memory usage per processor stays fixed • Scaled Speedup: Time(1) / Time(p) for scaled up problem • Let M be the memory requirement of a given problem • Let W = g(M) or M = g-1(W) where The fixed-memory speedup is defined by:
Impact of Scaling Models: Grid Solver • For sequential n x n solver: memory requirements O(n2). Computational complexity O(n2) times number of iterations (minimum O(n)) thus O(n3). • Memory Constrained (MC) Scaling: • Memory requirements stay the same: O(n2) per processor. • Grid size = • Iterations to converge = • Workload = • Ideal parallel execution time = • Grows by • 1 hr on uniprocessor means 32 hr on 1024 processors. • Time Constrained (TC) scaling: • Execution time remains the same O(n3) as sequential case. • If scaled grid size is k-by-k, then k3/p = n3, so k = . • Memory needed per processor = k2/p = • Diminishes as cube root of number of processors
Impact on Solver Execution Characteristics • Concurrency: Total Number of Grid points • PC: fixed; • MC: grows as p; • TC: grows as p0.67 • Comm. to comp. Ratio: Assuming block decomposition • PC: grows as ; • MC: fixed; • TC: grows as • Working Set: PC: shrinks as p; MC: fixed; • TC: shrinks as • Expect speedups to be best under MC and worst under PC.
Scalability Metrics • The study of scalability is concerned with determining the degree of matching between a computer architecture and and an application algorithm and whether this degree of matching continues to hold as problem and machine sizes are scaled up . • Basic scalablity metrics affecting the scalability of the system for a given problem: Machine Size n Clock rate f Problem Size s CPU time T I/O Demand d Memory Capacity m Communication/other overheads h(s, n), where h(s, 1) =0 Computer Cost c Programming Overhead p
Machine Size CPU Time Hardware Cost Scalability of An architecture/algorithm Combination Memory Demand I/O Demand Communication Overhead Programming Cost Problem Size Parallel Scalability Metrics
Revised Asymptotic Speedup, Efficiency • Revised Asymptotic Speedup: • s problem size. • T(s, 1) minimal sequential execution time on a uniprocessor. • T(s, n) minimal parallel execution time on an n-processor system. • h(s, n) lump sum of all communication and other overheads. • Revised Asymptotic Efficiency:
Parallel System Scalability • Scalability (informal very restrictive definition): A system architecture is scalable if the system efficiency E(s, n) = 1 for all algorithms with any number of processors and any size problem s • Another Scalability Definition (more formal): The scalability F(s, n) of a machine for a given algorithm is defined as the ratio of the asymptotic speedup S(s,n) on the real machine to the asymptotic speedup SI(s, n) on the ideal realization of an EREW PRAM
Example: Scalability of Network Architectures for Parity Calculation Table 3.7 page 142 see handout
Ideal Parallel Computers Message-passing multicomuter with distributed memory Increased Scalability Multiprocessor with shared memory Increased Programmability Programmability Vs. Scalability
Evaluating a Real Machine • Performance Isolation using Microbenchmarks • Choosing Workloads • Evaluating a Fixed-size Machine • Varying Machine Size • All these issues, plus more, relevant to evaluating a tradeoff via simulation
Performance Isolation: Microbenchmarks • Microbenchmarks: Small, specially written programs to isolate performance characteristics • Processing. • Local memory. • Input/output. • Communication and remote access (read/write, send/receive) • Synchronization (locks, barriers). • Contention.
Types of Workloads/Benchmarks • Kernels: matrix factorization, FFT, depth-first tree search • Complete Applications:ocean simulation, ray trace, database. • Multiprogrammed Workloads. • Multiprog. Appls Kernels Microbench. Realistic Complex Higher level interactions Are what really matters Easier to understand Controlled Repeatable Basic machine characteristics • Each has its place: • Use kernels and microbenchmarks to gain understanding, but applications to evaluate effectiveness and performance
Desirable Properties of Workloads • Representativeness of application domains • Coverage of behavioral properties • Adequate concurrency
Representativeness • Should adequately represent domains of interest, e.g.: • Scientific:Physics, Chemistry, Biology, Weather ... • Engineering:CAD, Circuit Analysis ... • Graphics:Rendering, radiosity ... • Information management:Databases, transaction processing, decision support ... • Optimization • Artificial Intelligence:Robotics, expert systems ... • Multiprogrammed general-purpose workloads • System software:e.g. the operating system
Coverage: Stressing Features • Some features of interest: • Compute v. memory v. communication v. I/O bound • Working set size and spatial locality • Local memory and communication bandwidth needs • Importance of communication latency • Fine-grained or coarse-grained • Data access, communication, task size • Synchronization patterns and granularity • Contention • Communication patterns • Choose workloads that cover a range of properties
4n 2n p p Coverage: Levels of Optimization • Many ways in which an application can be suboptimal • Algorithmic, e.g. assignment, blocking • Data structuring, e.g. 2-d or 4-d arrays for SAS grid problem • Data layout, distribution and alignment, even if properly structured • Orchestration • contention • long versus short messages • synchronization frequency and cost, ... • Also, random problems with “unimportant” data structures • Optimizing applications takes work • Many practical applications may not be very well optimized • May examine selected different levels to test robustness of system
Concurrency • Should have enough to utilize the processors • If load imbalance dominates, may not be much machine can do • (Still, useful to know what kinds of workloads/configurations don’t have enough concurrency) • Algorithmic speedup: useful measure of concurrency/imbalance • Speedup (under scaling model) assuming all memory/communication operations take zero time • Ignores memory system, measures imbalance and extra work • Uses PRAM machine model (Parallel Random Access Machine) • Unrealistic, but widely used for theoretical algorithm development • At least, should isolate performance limitations due to program characteristics that a machine cannot do much about (concurrency) from those that it can.
Effect of Problem Size Example 1: Ocean n-by-n grid with p processors (computation like grid solver) • n/p is large • Low communication to computation ratio • Good spatial locality with large cache lines • Data distribution and false sharing not problems even with 2-d array • Working set doesn’t fit in cache; high local capacity miss rate. • n/p is small • High communication to computation ratio • Spatial locality may be poor; false-sharing may be a problem • Working set fits in cache; low capacity miss rate. • e.g. Shouldn’t make conclusions about spatial locality based only on small problems, particularly if these are not very representative.
Sample Workload/Benchmark Suites • Numerical Aerodynamic Simulation (NAS) • Originally pencil and paper benchmarks • SPLASH/SPLASH-2 • Shared address space parallel programs • ParkBench • Message-passing parallel programs • ScaLapack • Message-passing kernels • TPC • Transaction processing • SPEC-HPC • . . .
Multiprocessor Simulation • Simulation runs on a uniprocessor (can be parallelized too) • Simulated processes are interleaved on the processor • Two parts to a simulator: • Reference generator: plays role of simulated processors • And schedules simulated processes based on simulated time • Simulator of extended memory hierarchy • Simulates operations (references, commands) issued by reference generator • Coupling or information flow between the two parts varies • Trace-driven simulation: from generator to simulator • Execution-driven simulation: in both directions (more accurate) • Simulator keeps track of simulated time and detailed statistics.
Execution-Driven Simulation • Memory hierarchy simulator returns simulated time information to reference generator, which is used to schedule simulated processes.