Download
1 / 64
680 likes | 974 Vues
Primary Education . A Global Report. The State of Education Series. March 2013. Summary. This presentation includes data on: Enrollments Out of School Children (OOS) of primary school age Income/Gender/Location Disparities Pupil /Teacher Ratios Repetition Primary Completion

E N D
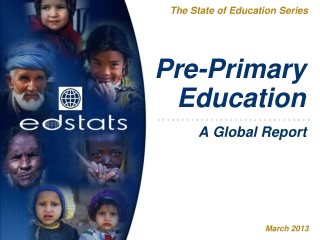
Primary Education A Global Report The State of Education Series March 2013
Summary This presentation includes data on: • Enrollments • Out of School Children (OOS) of primary school age • Income/Gender/Location Disparities • Pupil/Teacher Ratios • Repetition • Primary Completion • Learning Outcomes • Education Expenditures on Primary Education
How many children are enrolled in primary schools? • Around 691 million children were enrolled in primary school in 2010. This is up from 685 million in 2005 and 655 million in 2000. • Over half of enrolled students were in either SAS or EAP (182 and 172 million respectively). • 21% of total primary enrollments were in India and 15% were in China. • 330 million (47.7%) were girls.
Have primary enrolments improved? Primary – Adjusted Net Enrollment Rates (ANER) Primary Enrolment Rates have increased since 2000, but little progress has been made since 2008. • In 2010, 90.7% of primary school age children around the world were enrolled in primary or secondary education. • This figure rose each year between 1999 (83.7%) and 2008, but the figure remained unchanged between 2008 and 2010. • All regions have increased ANERs since 2000, but SSA and SAS improved the most – 16 percentage points in SSA and 14 percentage points in SAS. Continued…
Have primary enrolments improved? Primary – Adjusted Net Enrollment Rates (ANER) Primary Enrolment Rates have increased since 2000, but little progress has been made since 2008. • Since 2008, SSA has only improved by 0.1% and SAS by 0.4%. • SAS's improvement moved it closer to other regions by 2010 (92.3%), but SSA still lags far behind with a ANER of 76.2% in 2010. • ECA’s ANER peaked in 2002 at 96.6% and has been lower since. • EAP and LAC are the only 2 regions with ANERs higher than 95% in 2010.
Which countries have the lowest primary enrollment rates? • In the top 2 countries (Eritrea and Djibouti), less than half of primary school age children are enrolled in primary school. • All of the countries with the lowest adjusted net enrollment rates (ANER) are in SSAexcept Djibouti. • Of the 20 countries with the lowest primary ANERs,15 are in SSA. • There is a large range among the listed countries: #10 Gambia’s ANER almost doubles #1 Eritrea’s.
Which countries have increased primary enrollment rates the most? • These countries have increased their primary ANERs by 22 to 42 percentage points between 1999/2000 and 2010/2011. • Ethiopia and Niger more than doubled their ANERs, but more than 1/3 of children are still not enrolled in Niger. • Only Zambia has increased its ANERto over 90%. All the countries need to continue improving to reach universal primary enrolment.
Adjusted Net Enrollment Rate. Primary (%) Source: UNESCO Institute for Statistics in EdStats, 2012 Note: Data displayed is for the latest available year (2008-2011) The maps displayed were produced by EdStats. The boundaries, colors, denominations and any other information shown on this map do not imply, on the part of the World Bank Group, any judgment on the legal status of any territory, or any endorsement or acceptance of such boundaries. The maps are for reference only.
Do countries with low national income per capita have low primary enrollments? There is no clear association between low national income p.c. and low primary enrollment rates. • Low income does not necessarily indicate lower primary enrolment rates: Countries with the lowest gross national income (GNI) per capita (<$500) have ANERs ranging from 35% (Eritrea) to 97.5% (Malawi). • Countries with the lowest primary ANERs (less than 75%) have GNI p.c. less than $1270. Equatorial Guinea is the only exception with 56.3% primary ANER and $14,540 GNI pc.
Which regions have reached gender parity in primary enrollments? • All regions except MNA and SSA are within 0.03 of gender parity in primary enrollments. • Gender parity indices (GPIs) are calculated by dividing the female value for an indicator by the male value, so perfect gender parity equals 1. A value below 1 indicates a bias toward males. A value above 1 indicates a bias toward females. • Globally, the GPI has been increasing from .93 in 1999 to .98 in 2010. • Most regions are very close to gender parity (+/- 0.03). Only MNA and SSA lag behind. • EAP, ECA, and LAC have achieved gender parity in primary (+/- 0.02).
Have most countries reached gender parity in primary enrollments? • 78% of countries are within 0.05 of gender parity in primary enrollments. • Half of countries with data have already achieved gender parity (+/- .02). • 78% of countries with data are within 0.05 of gender parity. • Many more countries have a bias toward males in primary enrolments (GPI<1). • Afghanistan has the largest male bias at .69 followed by Central African Rep. and Chad at .73. • San Marino has the highest female bias at 1.134. Female Bias Male Bias
Which countries have the largest gender disparities in primary enrolment rates? • The male primary gross enrolment rate in these countries is much higher than the female gross enrolment rate. • 7 of 10 countries are in SSA. 2 are in South Asia and 1 is in MNA. • Of the 20 countries with the lowest GPIs (GPI<0.9),14 are in SSA, 2 are in SAS, 2 are in EAP (Togo and PNG), and 1 is in LAC (Dominican Republic).
Which countries have decreased gender disparity in primary the most? • These countries have moved from 0.14 to 0.25 percentage points closer to gender parity (1) between 2000/2001 and the most recent data year. • 6 of the 10 countries are in SSA; 2 are in MNA and 2 in South Asia. • Senegal now has higher female enrollment rates than male enrollment rates (1.06). • Burundi and India have reached gender parity.
Do gender, income, or location disparities exist in primary attendance rates? • Gender, income and location disparities are small in all regions except except SAS and SSA. • EAP, ECA, LAC, and MNA do not have large disparities in primary net attendance rates (NAR) between genders, rural/urban locations, or top/bottom income quintiles. • The largest disparities in most regions are associated with income. In SSA and SAS, there is a 20 percentage point difference between the top/bottom income quintiles. • Rural students in SSA also have NARs that are 12 percentage points lower than urban students.2
Which regions have the highest percentage of children out-of-school? Rates of Children Out-of-School have decreased since 1999, but progress has slowed since 2008. • In 1999, 16% of primary school age children were OOS. 42% of children in SSA and almost a quarter of children in SAS were OOS. • By 2010, 9.3% of children were OOS globally, but SSA’s rate was still much higher at 23.8%. • Most of the progress in reducing the rate of children OOS occurred between 1999 and 2008. Since 2008, global and regional rates have basically remained the same.
Which countries have highest rates of children out-of-school? • More than half of primary-school age children are out of school in Eritrea and Djibouti. • More than a quarter of primary school aged children are out-of-school in 14 countries. • 47 countries have more than 10% of children out-of-school. • Nine of ten countries are in SSA.
Out-of-school rate for children of primary school age (%) Source: UNESCO Institute for Statistics in EdStats, Nov. 2012 Note: Data displayed is for the latest available year (2008-2011) The maps displayed were produced by EdStats. The boundaries, colors, denominations and any other information shown on this map do not imply, on the part of the World Bank Group, any judgment on the legal status of any territory, or any endorsement or acceptance of such boundaries. The maps are for reference only.
Which region has the most out of school (OOS) children? Out-of-School Children of Primary School Age by Region (2010) • In 2010, ¾ of the world’s out-of-school (OOS) children lived in two regions: SSA and SAS. • Over half (55%) of the world's out of school children lived in SSA. • ECA had the smallest percentage of the world’s OOS children at 1.8% followed by MNA (3.9%) and LAC (4.4%).
How many primary school age children are out of school (OOS)? The total number of out-of-school children has decreased by 47 million since 1999. • In 1999, 107.7 million children were out of primary school. • The total decreased to 72.6 million in 2005 and 60.7 million in 2010. • There were 47 million fewer children OOS in 2010 than in 1999. • Since 2008, the global number of out-of-school children has grown from 60.66 million to 60.69 million (2009) and 60.73 million in 2010.
How much have regions decreased the total number of OOS children? All regions have decreased their total number of out-of-school children since 1999. • SAS and MNA more than halved the total number of OOS children between 1999 and 2010. In SAS, the total number of OOS children decreased by 25.6 million or 66%. • SSA decreased the total number by 12.3 million, which was a 27% decrease between 1999 and 2010, but the total number increased by 1.5 million between 2008 and 2010.
Which countries have the most out-of-school children? • 45.8% of the world’s out-of-school children live in the 10 countries listed here. • Five of the countries are in SSA and 3 are in SAS. • Nigeria almost has as many OOS children as the regional totals for LAC, ECA, and MNA combined (10.9 million). • The US is #8 in the ranking because of the large size of the school age population and also possibly because of a lack of consistent data collection on home-schooled children.
Are more females out-of-school than males? More Females are Out of Primary School than Males • In 1999, there were almost 62 million females out-of-school compared to 45.5 million males. 58% of the world’s out-of-school children were female. • In 2010, around 32 million girls were out of school compared to 28.6 million boys. 52.5% of out-of-school children were female. • The gap between male and female totals decreased from 16.5 million to 3.6 million between 1999 and 2010.
Where are more females out-of-school? 3 out of every 4 Out-of-School Girls are in either Sub-Saharan Africa or South Asia • Over half of the world’s out of school girls are in SSA, and just under 1/4 are in South Asia. • South Asia has decreased its total number of females out-of-school by 17.7 million since 1999. The region’s total dropped from 25 million to 7 million. • SSA has also decreased its total from 24.3 million in 1999 to 17.5 million in 2010.
Which countries have the most females OOS? • Around half of the world’s out-of-school females live in these 10 countries. • 36% of the world’s out-of-school females live in the Top 4 countries. • Nigeria, Pakistan, and India all have more our-of-school females that the sum of all females out-of-school in LACand ECA. • Half of the countries are in SSA and three are in South Asia.
Are there gender, income, or location disparities in the % of children OOS? • Low income is the greatest source of disparity in percentages of OOS children across regions. • In all regions, more low income students are OOS than high income students. SAS has the largest income disparity at 29 percentage points difference between the top and bottom quintiles. SSA follows closely behind with 24 points. • A higher % of boys are OOS in EAP, ECA, and LAC, but a higher % of girls are OOS in SAS and SSA. • In all regions except for ECA, a higher % of rural students are OOS. This disparity is highest in SSA at 15 percentage points.2
Do rural/urban disparities in educational access exist in SSA? Percentage of 7 to16 year olds who has never been to school. • Percentage of the population in the official age range of lower secondary education not in school Source: Demographic and Health Surveys and Multiple Indicator Cluster Surveys In World Inequality Database on Education (WIDE), Nov. 2012
Do income disparities exist in educational access in SAS and EAP? • South Asia (SAS) Percentage of 7 to16 year olds who has never been to school. • East Asia and the Pacific (EAP) Source: Demographic and Health Surveys and Multiple Indicator Cluster Surveys In World Inequality Database on Education (WIDE), Nov. 2012
Which regions have higher primary pupil-teacher ratios? • Sub-Saharan Africa and South Asia have the highest primary pupil-teacher ratios. • Globally, primary pupil-teacher ratios (PTRs) have declined from 26 pupils per teacher in 1999 to 24 in 2011. • SSA has the highest PTR in 2011 at 43 pupils per teacher. SAS also has a high PTR in 2009 at 40. • All other regions have PTRs less than 23 with declining PTRs over time. • EAP has the fewest students per teacher in 2011 (18) followed by ECA at 19.
Which countries have the highest primary pupil-teacher ratios? • These countries have between 51 and 81 primary students per teacher. • 26 countries have more than 40 primary pupils per teacher. All of these countries are in SSAexcept Cambodia. • There are 10 countries with primary PTRs less than 10 and 46 countries with PTRs less than 15. Most are high income countries.
Which countries have decreased primary pupil-teacher ratios the most? • These countries have decreased their primary pupil-teacher ratios by 12 to 18 pupils per teacher over time. • The most current PTR for all of these countries except Cameroon and Ethiopia is less than 35 students per teacher. • Despite great improvement, Ethiopia still has around 55 pupils per teacher.
Pupil-Teacher Ratio. Primary (2006-2012) Source: UNESCO Institute for Statistics in EdStats, 2013 Note: Data displayed is for the most recent available year The maps displayed were produced by EdStats. The boundaries, colors, denominations and any other information shown on this map do not imply, on the part of the World Bank Group, any judgment on the legal status of any territory, or any endorsement or acceptance of such boundaries. The maps are for reference only.
Which regions have the highest primary repetition rates? • Levels of primary repetition are higher in LAC and SSA and lower in ECA and EAP. • Globally, the percent of repeaters in primary schools has decreased from 5.3% in 1999 to 4.8% in 2011. • Repetition rates have consistently been lowest in ECA and EAP (less than 2.3% over time). • SSA and LAC have had the highest levels of repetition over time, but both regions improved from around 12% to around 8% over time. • SAS is the only region with a higher current repetition rate (4.9% in 2009) than in 1999 (4.7%).
Which countries have the highest repetition rates in primary? • One third of students repeat in Burundi and almost ¼ repeat in Comoros. • All countries on the list are in SSA. 17 out of the top 20 are also in SSA. Timor-Leste, Iraq, and Suriname are the exceptions. • Six countries in the list have decreased repetition over time: Madagascar, Congo, Lesotho, Togo, Chad, and Comoros. • Burundi’s repetition rate has increased by almost 10 percentage points over time from 26.3% in 2002 to 36.2% in 2011.
Which countries have decreased primary repetition rates the most? • These countries have decreased their primary repetition rates by 8 to 22 percentage points over time. • 9 of 10 countries are in SSA. • 6 countries have more than halved their repetition rates. • Despite great improvement, 7 of the countries have current repetition rates higher than 10%.
Primary Repetition Rate (%) (2006-2012) Source: UNESCO Institute for Statistics in EdStats, 2013 Note: Data displayed is for the most recent available year The maps displayed were produced by EdStats. The boundaries, colors, denominations and any other information shown on this map do not imply, on the part of the World Bank Group, any judgment on the legal status of any territory, or any endorsement or acceptance of such boundaries. The maps are for reference only.
Do females repeat more than males in primary schools? • Males repeat more than females in all regions except ECA. • Globally, there is less than half a percentage point difference between male/female repetition rates. Males repeat slightly more than females. • Males also repeat more than females in all regions except for ECA. • The greatest gender disparity is in MNA at 2.5 percentage points. • In SSA, there is almost no difference in repetition rates between males and females.
Which regions have higher primary completion rates? • Primary Completion Rates have been increasing in all regions since 1999. • 90.3% of primary school age students completed primary school in 2011. This is a 9.3 percentage point increase since 1999. • All regions have improved their primary completion rates (PCR) over time. • SAS had the largest increase at 23.3 percentage points, but still lags behind other regions with 88% of students completing primary in 2011. (continued on next slide)
Which regions have higher primary completion rates? (continued) • Primary Completion Rates have been increasing in all regions since 1999. • SSA also improved greatly over time (17.8 percentage points) but lagged far behind other regions in 2011 with a 70% PCR. • In 2011, LAC had the highest share of primary school age students completing primary school at 101.6%. PCRs over 100% are typically due to over/under age students entering the last grade of primary or repetition.
Which countries have the lowest primary completion rates? • Less than half of primary school age children complete primary school in the top 7 countries. • 9 of 10 countries are in SSA. • All the countries on the list have increased their PCRs over time except Uganda and Equatorial Guinea. • Niger and Mali have increased their PCRs the most over time – 25 and 21 percentage points respectively.
Which countries have increased primary completion rates the most? • These countries have increased their primary completion rates by 31 to 43 percentage points over time. • 5 countries have more than doubled their primary completion rates. • Despite great improvement, 7 of the 10 countries have current primary completion rates less than 75%.
Primary Completion Rate (2006-2012) Source: UNESCO Institute for Statistics in EdStats, 2013 Note: Data displayed is for the most recent available year The maps displayed were produced by EdStats. The boundaries, colors, denominations and any other information shown on this map do not imply, on the part of the World Bank Group, any judgment on the legal status of any territory, or any endorsement or acceptance of such boundaries. The maps are for reference only.
Are more boys completing primary school than girls? • Globally and in most regions, more males complete primary school than females. • Globally, more males are completing primary school than females. The difference between male/female PCRs has shrunk from 6 percentage points in 1999 to 1.8 in 2011. • In most regions, more males complete primary than females, but in LAC and EAP, the reverse is true. • EAP's female PCR was 2.4 percentage points higher than the male PCR. LAC’s was 0.7 percentage points higher for females. (continued on next slide)
Are more boys completing primary school than girls? (continued) • Globally and in most regions, more males complete primary school than females. • SSA has the largest gender disparity in PCRs with 74% of boys completing vs. 67% of girls in 2011. • MNA also has a large gender disparity at 6 percentage points difference between the genders. • SAS had a large gender disparity in 1999 (15 percentage points) but decreased the difference to 2.7 percentage points in 2010.
Primary Completion Rate. Female (2006-2012) Source: UNESCO Institute for Statistics in EdStats, 2013 Note: Data displayed is for the most recent available year The maps displayed were produced by EdStats. The boundaries, colors, denominations and any other information shown on this map do not imply, on the part of the World Bank Group, any judgment on the legal status of any territory, or any endorsement or acceptance of such boundaries. The maps are for reference only.