Download
1 / 17
170 likes | 232 Vues
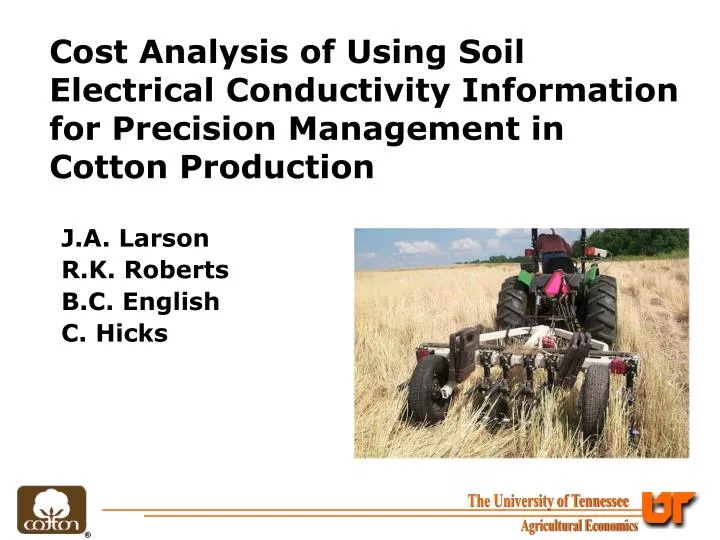
Cost Analysis of Using Soil Electrical Conductivity Information for Precision Management in Cotton Production. J.A. Larson R.K. Roberts B.C. English C. Hicks. Introduction. One of the most popular precision farming technologies used by cotton farmers is grid soil sampling.

E N D
Cost Analysis of Using Soil Electrical Conductivity Information for Precision Management in Cotton Production J.A. Larson R.K. Roberts B.C. English C. Hicks
Introduction • One of the most popular precision farming technologies used by cotton farmers is grid soil sampling. • With grid soil sampling, GPS technology is used to create small sub-field areas for soil sampling—typically 2.5 acre (1 hectare) grids. • 205 of 1,021 (20%) farmers in a 2005 survey of cotton farmers used grid soil sampling. Source: Veris Technology
Introduction • Grid sampling relies on labor-intensive manual sampling and laboratory analysis. • There is nearly as much variability within the 2.5 acre grid cells as among them. • The variability in grids raises questions about the usefulness of the grids in capturing actual field variability. • On-the-go soil electrical conductivity (EC) and pH sensing have been suggested as a way to more accurately measure soil variability. Source: Veris Technology
Introduction • Soil electrical conductivity (EC) is the ability of soil to conduct electrical current. • The most common method of EC data collection uses electrodes shaped like coulters that make contact with the soil to measure EC. • One set of coulters applies electrical current into the soil, while the other set of coulters measures the drop in voltage. • EC is influenced by a number of factors including clay content, soluble salts, bulk density, organic matter, soil moisture, and soil temperature. Source: Veris Technology
Introduction • Potential uses of EC information include: • Estimating soil properties—texture (sand, silt, clay), soil moisture, organic matter, topsoil depth, and soil salinity; • Measuring nutrient levels in the soil (e.g., nitrogen, potassium, etc); • Predicting pest distributions in fields; Interpretation of yield maps; and • Guidance for placement and interpretation of on-farm tests. • Potential management applications include: • Directed soil sampling within more accurate soil boundaries, • Drainage remediation, • Soil salinity remediation, • Delineation of management zones for input applications, • Variable rate pesticide application, and • Variable rate nutrient application.
Introduction • Currently, very little research has been done on the costs of collecting on-the-go EC and pH information versus the potential benefits to cotton farmers. • Whether it is economically feasible for farmers to use on-the-go EC and pH data will depend on what VRT decisions are made using the EC information. • Like any precision agriculture technology, if farmers can decrease their input costs or increase their yields using EC and pH information, they may be able to improve crop profitability. • Information on costs of on-the-go EC and pH data collection would be useful to farmers considering purchasing equipment and to consultants, input suppliers, and others interested in providing custom on-the-go services.
Objectives • Evaluate an equipment compliment designed to collect on-the-go EC and pH data in farm fields: • Ownership and operating costs as a function of farm size. • Breakeven values to cover the cost of the system: • Lint yield gains and • Reduced input costs.
Assumed Components of an EC and pH Information System • Veris Mobile Sensor Platform (MSP) with the EC/pH instrument package, dual array EC surveyor kit, and a Veris soil pH manager. • AgLeader GPS 3100 unit. • The GPS unit provides a way to geo-reference the EC and pH data to specific locations in the field. • AgLeader Advanced Lightbar unit. • The lightbar technology provides a way to provide precision guidance of the unit as it makes measurements throughout the field. • 65-HP tractor to pull the MSP unit through the field.
Calculating Ownership and Operating Costs for On-The-Go EC and pH data • Veris MSP Unit: • Depreciation and interest; • Repairs; • Electrodes; and • Taxes, insurance, and housing. • GPS and Guidance: • Depreciation and interest; • Repairs; • Taxes, insurance, and housing; and • GPS signal subscription. • Tractor: • Depreciation and interest; • Repairs; • Taxes, insurance, and housing; • Fuel and lube; and • Labor time.
Assumptions for Calculating Costs • All costs are charged to the cotton enterprise. • Average one trip per year for EC measurement is made over each cotton field. • Average one trip every four years for pH measurement is made over each cotton field. • Cotton enterprise sizes ranged from 500 acres up to 3,000 acres. • Recommended 9.3 pH samples/acre (4 mph travel speed, 80 ft between passes in the field) was used to calculate tractor time and electrode use: • 3 samples/acre (10 mph, 100 ft) • 5 samples/acre (5 mph, 100 ft) • 14.9 samples/acre (10 mph, 20 ft), and • 37.1 samples/acre (4 mph, 20 ft).
Breakeven Yield Gains and Input Cost Savings • VRT decisions made using EC and pH information: • Whole field N, P, K, and lime costs of $91.93/acre. • Input cost savings scenarios of 0%, 10%, 20%, and 30% were evaluated. • Analysis and VRT map making costs ($3/acre). • Difference in application cost for VRT over URT ($4.93/acre). • Cotton lint price used to calculate yield gains was $0.55/lb.
Annual Ownership and Operating Costs for Different Farm Sizes
Annual EC & pH Data Costs for Different Farm Sizes and Sampling Regimes
Annual EC & pH Data Costs for Different Farm Sizes and Sampling Regimes Cost/Acre ($)
Conclusions • More economically feasible for larger cotton farms to purchase EC and pH information gathering equipment because costs can be spread over more cotton acreage. • Farmers with a more cotton acreage may find it cheaper to own rather than custom hire depending on available labor resources.
Conclusions • If overall input usage remains the same, the required yield gains to payback the investment in EC and pH information range from: • 47 lb/acre for a 500 acre cotton enterprise, to • 22 lb/acre for a 3,000 acre cotton enterprise. • Yield gains to payback the investment are smaller if overall input usage is reduced from using on-the-go EC and pH information to make input decisions.