Download

1 / 13
130 likes | 136 Vues
This research focuses on the economic analysis of policies that incentivize farmers to adopt conservation tillage. The study uses aggregated data from the National Resource Inventory (NRI) and expert opinion surveys to estimate a model for conservation tillage adoption. The proposed approach allows for the recovery of individual-level model parameters using aggregated information on choices.

E N D
Estimation of a Discrete Choice Model when Individual Choices are Not Observable Luba Kurkalova and Sergey Rabotyagov Midwest Economics Association Meeting St. Louis, Missouri, March 29, 2003
Research Interest • Economic analysis of policies that pay farmers for adoption of conservation tillage • Basic data: National Resource Inventory (NRI), 1992 and 1997
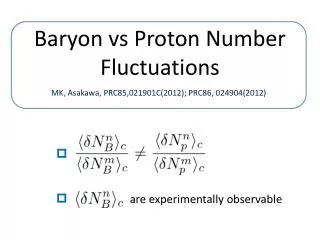
Probability of tillage choice Problem: in 1997, the are not available,But,grouped data on are available
Grouped data on conservation tillage choices • CTIC (Purdue) collects expert opinion surveys on adoption of conservation tillage • Reports percentage of area in conservation tillage by state, county, and crop, 1989- current • Conversion of area percentage data into count data NRI: 92 corn points in Boone county, IA CTIC: 55% corn in County#15 is in CT Count data (CTIC+NRI): 92*0.55=51 NRI corn points from Boone county must be in CT
Linear versus nonlinear model Nonlinear model Linear model Farm-level Aggregated Where
Proposed approach Express the likelihood of observing as a function of • original (farm-level) model parameters, and • Farm-level data on explanatory variables
Probability of observing 1 point in conservation tillage out of 3 points in a group
Application to 1992 NRI data • Random sub-sample (1,339 observations) of Iowa 1992 NRI data (soil and tillage) supplemented with Census of Agriculture (farmer characteristics) and climate data of NCDC • 63% of farmers use conservation till • Grouped the observed individual choice data into 240 groups by county and crop • Pretended that we do not observe individual choices
Results Variable Aggregated Discrete data model data model Corn dummy 44.7 41 (6.9) (11) Slope 0.56 0.22 (0.18) (0.12) Permeability 0.85 0.63 (0.37) (0.31) Water capacity 0.87 0.73 (0.32) (0.29) 5.69 6.0 (0.12) (1.6)
Problems • Programming • Area percentage versus percent of points • IA, County #5, corn, 1992 NRI • 75% area in CT could be represented by minimum 5 and maximum 7 points
Conclusions • Method allows recovery of individual-level model parameters with aggregated information on choices • Worked very satisfactory on artificially aggregated data