Download
1 / 13
130 likes | 240 Vues
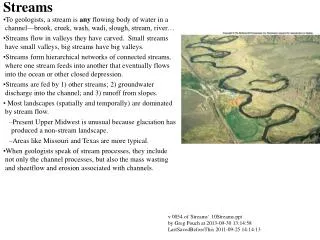
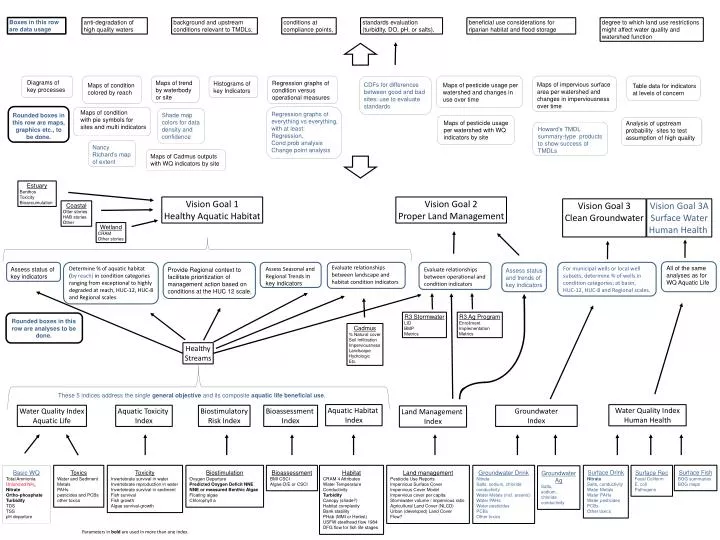
Boxes in this row are data usage. anti-degradation of high quality waters . background and upstream conditions relevant to TMDLs,. conditions at compliance points,. standards evaluation (turbidity, DO, pH, or salts),. beneficial use considerations for riparian habitat and flood storage.

E N D
Boxes in this row are data usage • anti-degradation of high quality waters • background and upstream conditions relevant to TMDLs, • conditions at compliance points, • standards evaluation (turbidity, DO, pH, or salts), beneficial use considerations for riparian habitat and flood storage • degree to which land use restrictions might affect water quality and watershed function CDFs for differences between good and bad sites: use to evaluate standards Diagrams of key processes Maps of condition colored by reach Nancy Richard’s map of extent Maps of trend by waterbody or site Histograms of key Indicators Regression graphs of condition versus operational measures Maps of Cadmus outputs with WQ indicators by site Maps of pesticide usage per watershed and changes in use over time Maps of impervious surface area per watershed and changes in imperviousness over time Table data for indicators at levels of concern Analysis of upstream probability sites to test assumption of high quality Determine % of aquatic habitat (by reach) in condition categories ranging from exceptional to highly degraded at reach, HUC-12, HUC-8 and Regional scales. Rounded boxes in this row are maps, graphics etc., to be done. Maps of condition with pie symbols for sites and multi indicators Provide Regional context to facilitate prioritization of management action based on conditions at the HUC 12 scale. Regression graphs of everything vs everything, with at least: Regression, Condprob analysis Change point analysis Evaluate relationships between landscape and habitat condition indicators Assess Seasonal and Regional Trends in key indicators Assess status of key indicators Maps of pesticide usage per watershed with WQ indicators by site Howard’s TMDL summary-type products to show success of TMDLs Shade map colors for data density and confidence Estuary Benthos Toxicity Bioaccumulation Vision Goal 1 Healthy Aquatic Habitat Vision Goal 2 Proper Land Management Vision Goal 3 Clean Groundwater Vision Goal 3A Surface Water Human Health Coastal Otter stories HAB stories Other Wetland CRAM Other stories All of the same analyses as for WQ Aquatic Life For municipal wells or local well subsets, determine % of wells in condition categories; at basin, HUC-12, HUC-8 and Regional scales. Assess status and trends of key indicators Evaluate relationships between operational and condition indicators R3 Stormwater LID BMP Metrics R3 Ag Program Enrollment Implementation Metrics Rounded boxes in this row are analyses to be done. Cadmus % Natural cover Soil Infiltration Imperviousness Landscape Hydrologic Etc. Healthy Streams These 5 indices address the single general objective and its composite aquatic life beneficial use. Aquatic Habitat Index Water Quality Index Human Health Water Quality Index Aquatic Life Aquatic Toxicity Index Biostimulatory Risk Index Bioassessment Index Groundwater Index Land Management Index Surface Fish BOG summaries BOG maps Surface Drink Nitrate Salts, conductivity Water Metals Water PAHs Water pesticides PCBs Other toxics Basic WQ Total Ammonia Unionized NH3 Nitrate Ortho-phosphate Turbidity TDS TSS pH departure Toxics Water and Sediment Metals PAHs pesticides and PCBs other toxics Toxicity Invertebrate survival in water Invertebrate reproduction in water Invertebrate survival in sediment Fish survival Fish growth Algae survival-growth Biostimulation Oxygen Departure Predicted Oxygen Deficit NNE NNE or measured Benthic Algae Floating algae Chlorophyll a Bioassessment BMI CSCI Algae O/E or CSCI Habitat CRAM 4 Attributes Water Temperature Conductivity Turbidity Canopy (shade?) Habitat complexity Bank stability PHab (MMI or Herbst) USFW steelhead flow 1984 DFG flow for fish life stages Land management Pesticide Use Reports Impervious Surface Cover Impervious Cover Model Impervious cover per capita Stormwater volume / impervious ratio Agricultural Land Cover (NLCD) Urban (developed) Land Cover Flow? Groundwater Drink Nitrate Salts, sodium, chloride conductivity Water Metals (incl. arsenic) Water PAHs Water pesticides PCBs Other toxics Surface Rec Fecal Coliform E. coli Pathogens Groundwater Ag Salts, sodium, chloride conductivity Parameters in bold are used in more than one index.
Home Trends Summary and Findings Technical Approach Goal 1: Healthy Aquatic Habitat: By 2025, 80% of aquatic habitat is healthy, and the remaining 20% exhibits positive trends in key measures of aquatic health. Percent Healthy (to status) Percent Improving (to trends) Goal 2: Proper Land Management: By 2025, 80% of lands within any watershed is managed to maintain healthy watershed functions, and the remaining 20% will exhibit positive trends in key management indicators. Goal 3: Healthy Water for Human Uses: By 2025, 80% of surface and ground water is clean for drinking and swimming, and fish and shellfish are safe to eat. The remaining 20% will exhibit positive trends in key measures of human health. Dave will adjust colors to blue, dk green, lt green, yellow, lt red, dk red You can’t see it here, but there is a text box below this map for adding details. Goals are clickable. The crown menu is something we need to figure out (where I have put placeholders – trends, summary and findings, technical approach, etc.)
Healthy Aquatic Habitat Water Quality Index Aquatic Life Aquatic Toxicity Index Biostimulatory Risk Index Bioassessment Index Aquatic Habitat Index Text below contains basic descriptions of indices, each index is clickable Bar charts show what percent of the Region (or watershed) is healthy (and should mimic our color scheme)
Water Quality Index Total Ammonia Nitrate Ortho-phosphate Turbidity TDS TSS pH departure Metals PAHs Pesticides PCBs Other toxics Text below contains basic descriptions of components of index, rationale for selection, each component is clickable to get a map of that analyte’s scoring, maybe a link to the data navigator, a link to the rule, etc. (See “About the Analyte on existing website”) – need to brainstorm
Possible entry pointsHow would you like to assess our information? • Map Navigator • Goals • Assessment Questions • Best and Worst Places • Fish and Wildlife • Waterbody Types • Report Card (Indicators/Indices) • Beneficial Uses
Icon lists • Tiny map • Assessment Questions? • Fish, test tubes, etc. • Best and Worst of the Central Coast (bad and good pics) • Problems
Water Body Types Harbors Nearshore coastal waters Wetlands Estuaries streams lakes Harbor Report Central Coast Portal link CC loading (website w/ loading context) BOG Maps and summaries MEQs for harbors data Pesticide Risk Sea otter stories Upstream imperviousness Other issues – microcystin (Pinto, Lopez), eutrophication, etc. HABs and nutrients Existing Studies Pesticide discharge to MPAs Postings, TMDLs: Nacimiento, Hernandez, OsoFlaco, Pinto, etc.
Fish and Wildlife Shellfish Nearshore Fish Sea otters Birds Benthic Inverts Steelhead Trout Harbor Study Tissue Chem – PBDE, PCB Base Flow Egg shell thinning in condors Sand Crabs Arrow Gobies - nonylphenol Water Quality CCLEAN Mussels Bacterial Disease Rockfish - mercury Caspian Terns Commercial shellfish closures IBIs and O/E HABs – domoic acid, microcystin etc. NOAA Critical Habitat* – overlay with healthy waters Sablefish - DDT Protozoal disease CEAM – Andy Gunther Sport shellfish closures from Red Tide * http://swr.nmfs.noaa.gov/cg/SCCC_Steelhead_Distribution_06_2005.jpg
Links • Water Quality Portal • EPA Healthy Water Quality • Recovery Potential • SWAMP • CCAMP • Reports • Regional WB/St Board
Technical Approach Mapping and NHD stuff Lab and Field Assessment Approach Index and Report Card Development References Assessment Questions Scoring and Grading Data Sources Aggregating measures into Indices Scoring Indices
Assessment Questions Text – List questions with short descriptive text, how we address it in the project
Data Sources CCAMP – include narrative description of program, level of QA, where to go for more info. SWAMP CCWQP 303(d)