Download
1 / 32
320 likes | 334 Vues
6. Common Stock Valuation: Understanding The Models. Common Stock Valuation. Our goal in this chapter is to examine the methods commonly used by financial analysts to assess the economic value of common stocks. These methods are grouped into three categories: Discounted cash flow models

E N D
6 Common Stock Valuation: Understanding The Models
Common Stock Valuation • Our goal in this chapter is to examine the methods commonly used by financial analysts to assess the economic value of common stocks. • These methods are grouped into three categories: • Discounted cash flow models • Residual Income models • Relative Valuation models • Understanding these models represents one component in the valuation process.
Security Analysis • Fundamental analysis is a term for studying a company’s accounting statements and other financial and economic information to estimate the economic value of a company’s stock. • The estimated economic value is referred to as the intrinsic valueof the stock.
Security Analysis: Uses • Analysts can use valuation concepts to: • Select stocks • Compare its intrinsic value per share to the current stock price. • Evaluate corporate events such as divestitures, mergers, etc. • Render fairness opinions • Appraise private businesses
Security Analysis: Process • Steps in the valuation process: • Understand the business • Forecast company performance • Select the appropriate valuation model • Convert forecasts to a valuation
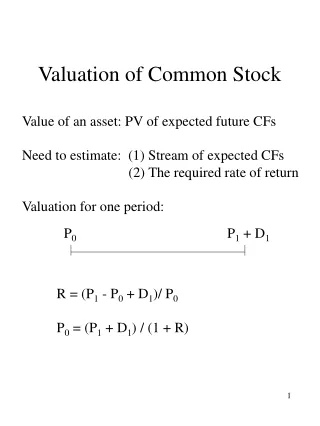
The Discounted Cash Flow Model • Discounted Cash Flow (DCF) models estimate the intrinsic value of a share of stock by discounting (calculating the present value of) all expected future cash flows from a firm. The basic DCF equation is: • In the DCF equation: • V(0) = the present value of all cash flows • CF(t) = the cash flow of the firm t years from now • k = the appropriate risk-adjusted cost of capital
Cash Flows • We can use two types of cash flows to estimate intrinsic value: Free cash flow to the firm (FCFF) or dividends. • When we use dividends as the cash flows used to estimate an intrinsic value for the firm, the model is referred to as the dividend discount model (DDM).
Discounted Cash Flow Models: Assuming constant growth in cash flows • If we can assume that the cash flows will growforever at a constant growth rate g, then the DCF model simplifies to: • What are the possible explanations if there is a difference in the current stock price and the intrinsic value we have calculated?
The Two-Stage DCF model • The two-stage DCF model assumes that a firm’s cash flows will initially grow at a constant rate g1 for T years or at a non-constant rate for T years, and thereafter grow at a rate g2 < k during a perpetual second stage of growth. • The Two-Stage DCF Model formula is:
Residual Income Model (RIM) • Earnings (net income) a firm generates ultimately belongs to the shareholders of the firm and represents the return shareholders generate on their capital (in book value terms). • Traditional accounting does not include a “charge” for equity capital, i.e., a cost for generating those earnings. • Specifically, a company may generate a positive net income but may not be adding value to its shareholders if it does not earn more than the cost of equity. • Residual incomerepresents the difference between actual earnings and required earnings and is sometimes referred to as Economic Value Added (EVA).
The Residual Income Model (RIM) • The RI model breaks down the intrinsic value of equity into two components: • The current book value of equity, plus • The present value of expected future residual income
The Residual Income Model (RIM) • The intrinsic value of common stock can be expressed as: where B(0) = current book value of equity per share B(t)= expected per-share book value at period t EPS(t) = expected Earnings per share for period t RI(t)= expected residual income per share for period t
The Residual Income Model (RIM) • In the model book value each period is determined by the following clean surplus relation: • The model also assumes that the growth in book value comes by the firm earning more than the cost of equity (ROE >k). The numerator of the second term can therefore be defined as:
Single-stage RIM • If we assume that the firm’s book value (and RI per share) will grow at a constant rate, g, forever, we can value a firm using a single-stage RI model: OR
Multi-stage RIM • If the assumption of constant growth is not appropriate, which may be particularly true if the firm currently generates a high ROE relative to the cost of equity, we can model the firm using two stages. • During the first stage we calculate present values of residual incomes individually. • In the second (terminal) stage we make one of the following assumptions about continuing residual income: • Residual income remains constant through perpetuity (and ROE > k) from the terminal year forward • Residual income is zero from the terminal year forward (ROE = k)
Multi-stage RIM • We can calculate the value today using a multi-stage model using the following formula • If RI is expected to be constant through perpetuity from terminal year forward, terminal value = RI(T) / k • If RI is expected to be zero from terminal year forward, terminal value = 0
Relative valuation • Relative valuation models specify an asset’s value relative to that of another asset using the assumption that similar assets should sell at similar prices. • Relative valuation is typically implemented using price multiples. • A firm is considered over-valued (under-valued) if the calculated intrinsic value (or multiple) is greater (less) than the current market price (comparable firm multiple)
Relative valuation • The intrinsic value of the firm using relative valuation is determined as: Comparable multiple * Firm-specific denominator value where the denominator value can be earnings, book value, sales, etc. • Example: Intrinsic value for firm X using P/E ratio would be calculated as: Comparable Firm P/E * Firm X EPS
Relative valuation • Underlying assumptions of comparable analysis: • Comparable firms, on average, are fairly valued • Comparable firms have similar fundamental characteristics to the firm being valued.
Relative Valuation: P/E ratio • Price-earnings ratio (P/E ratio) • Current stock price divided by annual earnings per share (EPS) • Earnings yield • Inverse of the P/E ratio: earnings divided by price (E/P) • High-P/E stocks are often referred to as growth stocks, while low-P/E stocks are often referred to as value stocks.
Relative valuation: P/E ratio • Let’s examine the P/E ratio a little more closely…. Stock price using a constant growth model: Price = CF(1) / (k – g) Then, P/E becomes.. P/E = CF(1) / (k – g) Earnings per share • By using P/E to value a firm, we are implicitly assuming that CF/Earnings, k and g for the comparable set of firms are approximately equal to that of the firm we are valuing.
Advantages and drawbacks of P/E • Advantages: • Earnings power is the chief driver of investment value • Main focus of security analysts • The P/E is widely recognized and used by investors • Drawbacks • If earnings are negative, P/E does not make economic sense • Reported P/Es may include earnings that are transitory • Earnings can be distorted by management • Assumption: • Required rate of return, CF/earnings and growth rates are similar among comparable firms
Relative valuation: PEG Ratio • “I don’t buy stocks with P/E’s over 30. To our Foolish ear, that sounds identical to: I don't buy hydrogenated milk because I am born in May.” Motley Fool • When comparable firm P/Es are used to calculate the value of a firm, the assumption is that the firm has characteristics that are similar to that of the average comparable firm. • However, differences may exist. For example, a higher P/E for a particular firm may be justified because the firm has higher growth.
Relative valuation: PEG Ratio • The Price/Earnings-to-Growth (PEG) accounts for differences in the growth in earnings between companies. • PEG is calculated as: P/E divided by expected earnings growth (%). • "The P/E ratio of any company that's fairly priced will equal its growth rate." Peter Lynch
Relative valuation: P/CF ratio • Price-cash flow ratio (P/CF ratio) • Current stock price divided by current cash flow per share • In this context, cash flow is usually taken to be net income plus depreciation. • Most analysts agree that in examining a company’s financial performance, cash flow can be more informative than net income.
Advantages and drawbacks of P/CF • Advantages: • Some analysts consider cash flow as perhaps a company’s most important financial barometer. • Cash flow is less subject to manipulation than earnings. • Drawbacks • The commonly used measure of cash flow does not account for other cash flow components, such as working capital. • Assumption: • Required rate of return and growth rates are similar among comparable firms
Relative valuation • Examples of other relative valuation multiples • Price/Book (P/BV) • Book value of equity is total shareholders equity – preferred stock • Price/Sales (P/S) • Price/EBITDA • EBITDA = Earnings before Interest Taxes Depreciation and Amortization
Advantages and drawbacks of P/BV • Advantages • Since book value is a cumulative balance sheet amount, it is generally positive • BV is more stable than EPS, therefore P/BV may be more meaningful when EPS is abnormally low or high • P/BV is particularly appropriate for companies with primarily liquid assets (financial institutions) • Disadvantages • Differences in asset age among companies may make comparing companies difficult • Human capital is not considered • Assumption: • Required rate of return, return on equity, CF/earnings and growth rates are similar among comparable firms
Advantages and drawbacks of P/S • Advantages • Sales are generally less subject to distortion or manipulation • Sales are positive even when EPS is negative • Sales are more stable than EPS, therefore P/S may be more meaningful when EPS is abnormally low or high • Disadvantages • High growth in sales may not translate to operating profitability • P/S does not reflect differences in cost structure • Assumption: • Required rate of return, profit margin, CF/earnings and growth rates are similar among comparable firms
Advantages and drawbacks of P/EBITDA • Advantages • It is more appropriate for comparing companies that have different capital structures since EBITDA is a pre-interest measure of earnings. • Appropriate for valuing companies with large debt burden: while earnings might be negative, EBITDA is likely to be positive. • Disadvantages • Differences in capital investment is not considered. • Assumption: • Required rate of return, growth rates, working capital needs, capital expenditures and depreciation are similar among comparable firms
Relative valuation: Comparables • Peer companies • Constituent companies are typically similar in their business mix • Industry or sector • Usually provides a larger group of comparables therefore estimates are not as effected by outliers • Own historical • This benchmark assumes that the firm will regress to historical average levels
Readings • The slides are loosely based on Chapter 6. I would suggest you focus more on the slides than the text for this material.