Download
1 / 39
390 likes | 529 Vues
Center Report from CMA. Short, Medium-range NWP. Xueshun Shen Center for Numerical Weather Prediction China Meteorological Administration. WGNE, Tokyo, Japan, 18-22 Oct. 2010. Outline. Short & Medium-range NWP systems Current status of operation system New implementation

E N D
Center Report from CMA Short, Medium-range NWP Xueshun Shen Center for Numerical Weather Prediction China Meteorological Administration WGNE, Tokyo, Japan, 18-22 Oct. 2010
Outline • Short & Medium-range NWP systems • Current status of operation system • New implementation • GRAPES_GFS: improvement toward operation • Research activities • New organization for NWP development and operation
Last WGNE presentation CMA headquarter decided: Freeze the current operational global NWP model: TL639L60 Put most of the resources to improve and develop the GRAPES system Big transition of NWP-related policy
1990-2010年NMC全球数值预报模式北半球500hPa高度场距平相关系数1990-2010年NMC全球数值预报模式北半球500hPa高度场距平相关系数 Evolution of ACC of 500 hPa Z 1990 2002 2008 T42 T63 T106 T213 T639
Performance of operational GRAPES_Meso WRF GRAPES
Observation Data TL639L60 Forecasts Si Data Processing Background GRAPES-4DVAR Analysis Fields Forecast GRAPES-Model Since Aug.2010 New Implementationfor pre-operational test GRAPES_MESO V3.0 with 4DVAR Model:GRAPES_MESO V3.0 Resolution: 15 km (502x330), 31 levels Time Step: 300 seconds Analysis System: GRAPES-4DVAR Outer loop resolution: The same resolution as the model Inner loop resolution: 45 km (167x111), 31 levels Physics process: LSP; MRF PBL; CUDU convection Outer loop: 1 iteration Obs: TEMP, SYNOP, AIREP, SHIPS Assimilation Window: [-3, 0] Analysis Time: 00UTC and 12UTC Background Fields:TL639L60 12-hours forecast Forecast Range: 48 hours
Light Heavy Torrential Moderate 1-month averaged Ts score of 24 hour precipitation forecast over whole China
48-hour accumulated precipitation 00Z03JUL2009-00Z04JUL2009 Initial time: 00Z02JUL2009 Obs CTRL 3DVAR 4DVAR
GRAPES_GFS1.0 :medium-range global forecast • GRAPES_Global 50km L36 with model top at 10 hPa • GRAPES_3DVAR at 1.125 degree (global version) • 6-hourly cycle • 240 hour forecast (12UTC) • Assimilated Obs. • GTS conventional data • NOAA15、16、17 • METEOSAT-9 & MTSATAMV • MODIS polar AMV Setup of GRAPES global forecast system since Jul. 2007 Presented in last WGNE
GRAPES_GFS 1.0global model • SISL dynamical core with mass fixer • Physics • Radiation: RRTMG LW(V4.71)/SW(V3.61) • Cumulus: Simplified Arakawa Schubert with modified entrainment and detrainment rates • Grid-scale precipitation: WSM-6 • Cloud: Xu & Randall diagnostic cloud • Land surface: CoLM • PBL: Modified Hong & Pan nonlocal PBL • Gravity wave drag: McFarlane 1987
GRAPES_GFS 1.0global 3DVAR • Incremental analysis • Digital filter • Recalculated background error covariance – NMC method • 1.125x1.125 resolution, 17 standard pressure levels • Bias correction scheme of satellite radiances based on simple linear regression (Harris and Kelly,2001): (1) 1000-300 hPa thickness, (2)200-50 hPa thickness.
Efforts in improving the forecast skill of GRAPES_GFS-toward operation- • Improve accuracy of initial values: data assimilation • ATOVS(NOAA-18,19,METOP,FY3) • GPS Reflectivity (COSMIC) • AIRS • IASI • Improve model performance • Improve the accuracy of finite difference scheme, especially, for PGF calculation • Hybrid vertical coordinate: from terrain-following to terrain-following & Z • Tuning of physical processes • Radiation: RRTMG • Land surface: SLAB to CoLM • GWD • SSO replaces the effective roughness length • Cumulus scheme tuning • Radiative energy budget (cloud-radiation) • Improve the forecast of synoptic evolution and accuracy of local weather elements, particularly those which have large impact on East Asian weather
Time series of Innvoationand Residual: Height(Sonde)N.H. 100hPa 500hPa 850hPa
Zonal mean temp. bias JJA (3d fcst.) old By introducing the new radiation Scheme: RRTMG new
Cloud-radiation interaction Improvement • New cloud cover parameterization • New cloud water path parameterization • Radiative effect of fractional cloud • Radiative effect of cloud inhomogeneity
Cloud cover parameterization Original scheme: binary cloud cloud=1 , when QC+QI >1.0e-6 cloud=0 , when QC+QI <1.0e-6 effective cloud drop radius: liquid 10µm、ice 80µm New scheme Liang and Wang(1995) Cloud cover: Combine Slingo and Slingo(1991 )and Kiehl et al.(1994); 4 cloud genus : convective cloud, anvil cirrus, inversion stratus andstratiform cloud. Fractional cloud cover and vertical cloud overlapping are considered effective cloud drop radius: liquid cloud: Savijarvi 1997 ice cloud: Kiehl et al. 1996
Cloud cover compared with ISCCP satellite data Using ISCCP Simulator Zonal mean total (TCC), high (HCC), middle (MCC) and low (LCC) cloud cover (%) of the ISCCP data (dashed) and the 5th day forecast by GRAPES using the ORG (thin solid) and NEW (thick solid) cloud scheme.
Improvement on radiation budget Comparison of surface radiation budget Errors reduce 14-47 1-8
Comparison of TOA radiation budget Errors reduce from 29-34 3-8
Low-level southerly bias GRAPES 3-day forecast • To mitigate southerly bias: • Introduce mountain blocking effect in GWD parameterization • Introduce small scale orography-induced form drag
24/48hr V-wind difference (20090701-0720) By introducing the mountain blocking effect in GWD parameterization Partly alleviated the low-level southerly bias.
Impact of SSO on low-level wind prediction Partly alleviated the low-level southerly bias.
Improved model performance • GRAPES_GFS1.2.0 :medium-range global forecast • GRAPES_Global 50km L36 with model top at 10 hPa • GRAPES_3DVAR at 1.125 degree • 6-hourly cycle • 240 hour forecast (00,12UTC) • Assimilated Obs. • GTS conventional data • NOAA15、16、17、18、19 • METOP-2 • AIRS • FY-3 radiance • METEOSAT-9 & MTSATAMV • MODIS polar AMV • COSMIC Refraction New version of GRAPES_GFS More satellite data assimilated
N. Hemsiphere ACC 500hPa Z JJA 2009 grapes operation S. Hemisphere
Near future upgrade activities • Global GRAPES_3DVAR • Arakawa-A & pressure level to Model grid space analysis • RTTOV: RTTOV7->RTTOV93 • VarBC • More satellite data: IASI, GRAS etc. • GRAPES global model • Hybrid vertical coordinate • Increase the vertical resolution • Conservative scalar SL advection: CSLR • Improve SL numerics • SETTLS: Stable extrapolating two-time-level semi-Lagrangian scheme • Continuous improvement of model physics
Research Activities • More satellite data • Cloud microphysics parameterization • Global GRAPES-4DVAR • Yin-Yang GRAPES • To avoid polar singularity problem • More homogeneous grid size
Progress of GRAPES Yin-Yang grid • The Helmholtz equation of GRAPES in the Yin-Yang overset grid are solved. • The transplant of the whole GRAPES dynamical core is finished. However, • some bugs exist and it need to be debuged in the next step. Helmholtz equation:
a F(a) 10-1 0.9993333298 10-2 1.0025374212 10-3 1.1345341283 wleft = 362468.822258871398 wright = 362468.822258874832 10-4 1.4307112695 10-5 1.0000002065 10-6 1.0000000959 10-7 0.9999999878 10-8 1.0000010258 10-9 1.0000153359 10-10 1.0000921071 10-11 1.0007362130 10-12 1.0499615795 Development of Global GRAPES_4DVAR • Finish the coding of tangent linear & adjoint model • Finish the accuracy check Adjoint code check
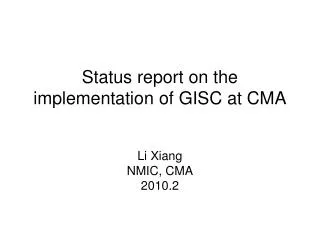
动力过程组 诊断与图形处理组 并行计算组 资料同化组 集合预报组 台风预报组 系统中试与运行 物理过程组 后处理与产品开发 版本管理 与信息技术 模式及应用检验 观测资料预处理、质量控制 区域模式组 Staff:73 CMA Numerical Prediction Center Development Branch Operation Branch Office 系统集成与测试组