Download
1 / 15
150 likes | 155 Vues
Calculation of evaporative emissions with COPERT Giorgos Mellios. Brussels, 04 October 2012. Contents. Summary of modifications to the COPERT model Results / input to cost-benefit analysis. Modifications to the COPERT model. Parking time distribution.

E N D
Calculation of evaporative emissions with COPERT Giorgos Mellios Brussels, 04 October 2012
Contents • Summary of modifications to the COPERT model • Results / input to cost-benefit analysis
Parking time distribution • Average duration of parking events ≥ 120 hours: 218 h
Trip distance distribution • Introduce trip distribution to better estimate canister status before parking • Average distance of trips ≥ 20 km: 39 km
Purging strategy • Purge volume as function of distance travelled: • 9.66 l/km for small cars • 16.68 l/km for medium and large cars • Purging increased (by 33/19) for all scenarios: • 16.77 l/km for small cars • 28.97 l/km for medium and large cars
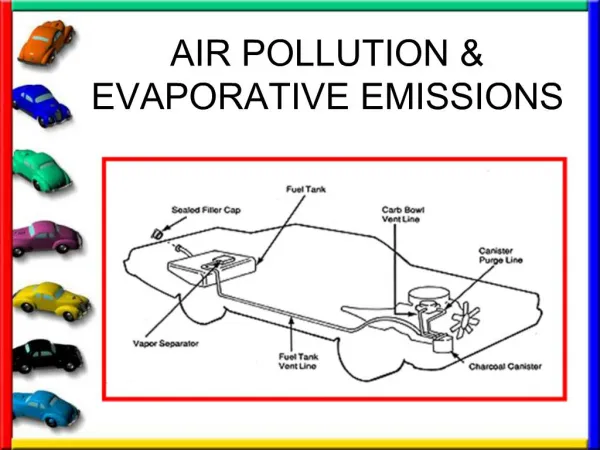
Permeation emissions • Non ethanol containing fuels: • 0.6 g/day for fluorinated tanks (34% of cars) • 0.2 g/day for multi-layer tanks (66% of cars) • Ethanol containing fuels (E5 – E10): • 0.3 g/day additional emissions from the fuel and vapour control system • Other sources (leakage etc.): 0.2 g/day (depending on fuel volatility and temperature)
Durability • Based on Swedish in-use data • Activated carbon efficiency decrease (for ethanol-containing fuel): • Small cars: 1% decrease every 8 000 km ~20% decrease over vehicle lifetime • Medium and large cars: 1% decrease every 32 000 km ~5% decrease over vehicle lifetime • Improved durability for scenario 3: • 1% decrease every 32 000 km for all cars ~5% decrease over vehicle lifetime
Outline of calculations performed • COPERT model adjusted to simulate different scenarios • Simulation runs with modified COPERT • Calculation of diurnal evap emissions for baseline and 3 Euro 6 scenarios • All EU-27 MS calculated • All years from 2015 to 2030 and 2017 to 2032 (depending on assumed implementation year) • Euro 6 vehicle fleet population and activity data from EC4MACS • Estimation of environmental benefits (VOC abated) for each scenario compared to baseline
Calculated diurnal emissions, EU (2015-2030) • Total diurnal emissions assuming all cars are equipped with multi-layer tanks Total diurnal emissions assuming 35% of small and medium cars are equipped with fluorinated tanks (except scenario 3)
Calculated diurnal emissions, EU (2017-2032) • Total diurnal emissions assuming all cars are equipped with multi-layer tanks Total diurnal emissions assuming 35% of small and medium cars are equipped with fluorinated tanks (except scenario 3)
Diurnal emission factors (2015-2030) • Average diurnal emission factors assuming all cars are equipped with multi-layer tanks Average diurnal emission factors assuming 35% of small and medium cars are equipped with fluorinated tanks (except scenario 3)
Observations • Significant emissions reduction potential • Activated carbon quantity (canister size) and quality (related to durability) seem to have the greatest effect, followed by fuel tank structure and purging strategy • Further emissions reductions may be achieved with the introduction of OBD