Download
1 / 5
50 likes | 58 Vues
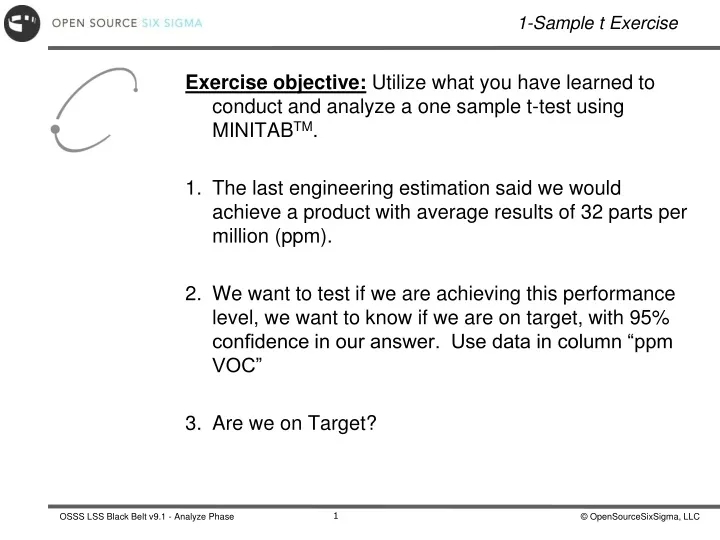
Exercise objective: Utilize what you have learned to conduct and analyze a one sample t-test using MINITAB TM . The last engineering estimation said we would achieve a product with average results of 32 parts per million (ppm).

E N D
Exercise objective: Utilize what you have learned to conduct and analyze a one sample t-test using MINITABTM. The last engineering estimation said we would achieve a product with average results of 32 parts per million (ppm). We want to test if we are achieving this performance level, we want to know if we are on target, with 95% confidence in our answer. Use data in column “ppm VOC” 3.Are we on Target? 1-Sample t Exercise
Since we do not know the population Standard Deviation, we will use the 1 sample T test to determine if we are at target. 1-Sample t Exercise: Solution
After selecting column C1 and setting “Hypothesis mean” to 32.0, click “Graphs…” and select “Histogram of data” to get a good visualization of the analysis. Depending on the test you are running you may need to select “Options…” to set your desired Confidence Interval and hypothesis. In this case the MINITABTM Defaults are what we want. 1-Sample t Exercise: Solution
Because we used the option of “Graphs…”, we get a nice visualization of the data in a histogram AND a plot of the null hypothesis relative to the confidence level of the population Mean. Because the null hypothesis is within the confidence level, you know we will “fail to reject” the null hypothesis and accept the equipment is running at the target of 32.0. 1-Sample t Exercise: Solution
In MINITABTM’s Session Window (ctrl – M), you can see the P-value of 0.201. Because it is above 0.05, we “fail to reject” the null hypothesis so we accept the equipment is giving product at a target of 32.0 ppm VOC. 1-Sample t Exercise: Solution