Download
1 / 39
390 likes | 398 Vues
The NISTmAb Interlaboratory NMR Study 1 H / 13 C Data Release 1 September 2017. Study Lead: Dr. Robert Brinson robert.brinson@nist.gov. Introduction About the Study Samples How the Time-Domain Data Files are Organized Experiment Codes About the Meta Data Table meta.tab

E N D
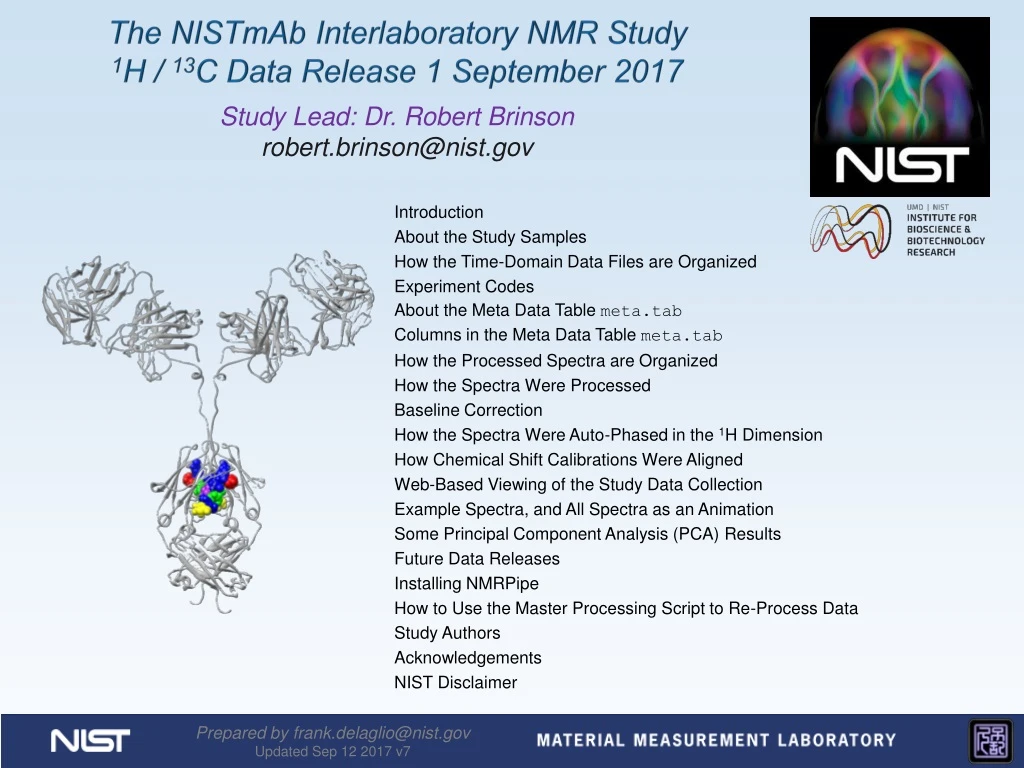
The NISTmAbInterlaboratory NMR Study 1H / 13C Data Release 1 September 2017 Study Lead: Dr. Robert Brinson robert.brinson@nist.gov Introduction About the Study Samples How the Time-Domain Data Files are Organized Experiment Codes About the Meta Data Table meta.tab Columns in the Meta Data Table meta.tab How the Processed Spectra are Organized How the Spectra Were Processed Baseline Correction How the Spectra Were Auto-Phased in the 1H Dimension How Chemical Shift Calibrations Were Aligned Web-Based Viewing of the Study Data Collection Example Spectra, and All Spectra as an Animation Some Principal Component Analysis (PCA) Results Future Data Releases Installing NMRPipe How to Use the Master Processing Script to Re-Process Data Study Authors Acknowledgements NIST Disclaimer Prepared by frank.delaglio@nist.gov Updated Sep 12 2017 v7
The NISTmAbInterlaboratory NMR Study 1H / 13C Data Release 1 Introduction The NISTmAbInterlaboratory NMR Study is a joint effort between 25 organizations to evaluate the performance of two-dimensional (2D) heteronuclear NMR as used to characterize the high order structure (HOS) of proteins, with the aim of supporting the use of NMR to characterize biologic therapeutics. The study was organized and led at NIST by Dr. Robert Brinson. In the study, each participating lab measured a series of NMR spectra on two kinds of solution-state protein samples, both based on the NISTmAb. The NISTmAb is a monoclonal antibody reference material available from NIST. It is intended to provide a representative molecule for testing and development of methods for therapeutic protein characterization: https://www.nist.gov/programs-projects/nist-monoclonal-antibody-reference-material-8671 This presentation describes the collection of 1H / 13C 2D NMR data produced by the study, so that the data can be distributed to the participants. The collection contains all the original time-domain data as measured by the participants, converted to a common format. It also includes corresponding spectra as processed at NIST, and the software scripts and processing parameters that were used to generate the spectra.
The NISTmAbInterlaboratory NMR Study 1H / 13C Data Release 1 About the Study Samples • 429 µM Unlabeled NIST-Fab (Fab) • Derived from papain cleavage of intact NISTmAb • Prepared at NIST/IBBR in Rockville, MD • 53 µM U-15N, 20%-13C NIST-Fab, System Suitability Sample (SSS) • Based on the amino acid sequence of the NISTmAb Fab domain. • Expressed in Pichia pastoris in the laboratory of Health Canada in Ottawa, Ontario, Canada • Contains an extra 4 amino acid signal peptide (EAEA) on both the light and heavy chains that did not get cleaved as expected. • Buffer: 25 mM bis-tris-d19 pH 6.0, 5% D2O
The NISTmAbInterlaboratory NMR Study 1H / 13C Data Release 1 How the Time-Domain Data Files are Organized • All data are in a master directory named “study”. • Data are stored in NMRPipe format (https://www.ibbr.umd.edu/nmrpipe). • Data are either uniformly-sampled (US) or Non-Uniformly Sampled (NUS). • The data are described by a text table “meta.tab” which includes measurement details, chemical shift calibration information, and processing parameters. • Each participating lab has an anonymous 4-digit Lab ID number, and all the data from that lab is in a directory with that 4-digit ID. • Within data from a given lab, each spectrum from that lab has a 3-digit Measurement ID. • The file names associated with a given spectrum have names with the Lab ID and Measurement ID. For example, lab 8822 has these files associated with measurement 37 from that lab: • study / 8822 / 8822-037.infoText file with acquisition information • study / 8822 / 8822-037.fidTime-domain data, NMRPipe format • study / 8822 / 8822-037.nusNUS sampling schedule text file, if any • study / 8822 / 8822-037_mask.fidNMRPipe-format NUS mask data, if any • study / 8822 / 8822-037.comNMRPipe processing script
The NISTmAbInterlaboratory NMR Study 1H / 13C Data Release 1 Experiment Codes • The type of measurement for each spectrum is described by a two or three letter experiment code. The codes for 1H / 13C spectra are: • D2AgsHSQC Uniformly-Sampled (US), 64 complex points. • D2BgsHSQC 50% Non-Uniformly Sampled (NUS). • D2CgsHSQC US, field dependent, 25ms acquisition. • D2DgsHSQC 50% NUS. • D2EgsHSQC 50% NUS, 2x scans of D2D. • D3AgsHSQC US, field dependent. • D3BgsHSQC 50% NUS, 25ms acquisition. • E1gsHSQC One parameter change from experiments D; • For NUS measurements, the NIST NUS schedule was used. • E1AgsHSQC Custom NUS schedule. • E1BgsHSQC Temperature change. • E1C sfHMQCsofast HMQC.
The NISTmAbInterlaboratory NMR Study 1H / 13C Data Release 1 About the Meta Data Table meta.tab • The text table “meta.tab” includes measurement details, chemical shift calibration information, and processing parameters for all the 1H / 13Cspectra in the study. • Each spectrum is described by one line in the table. • There are 375 spectra listed. • The VARS line names the columns of the table. • The FORMAT line encodes what kind of information is stored in a column, either integer (%d) text (%s) or floating point values (%f). • Excerpt: VARS INDEX DIR_NAME CODE TITLE XP0 XP1 Y_FTARG YP0 YP1 XBASE_FRAC XBASE_ORD YBASE_ORD DX_PPM DY_PPM COLOR NOTE FORMAT %3d %4s %8s %26s %6.1f %6.1f %7s %6.1f %6.1f %.3f %4s %7s %8.5f %8.5f %s %s 1 8822 8822-010 D2C-S-U-900-8822-010-37C 61.2 -98.9 None 90.0 0.0 0.050 4 Default 0.05352 0.01269 #00ffff “Reference Spectrum” 2 7425 7425-010 D2A-S-U-900-7425-010-37C 60.6 -107.5 None -90.0 0.0 0.050 4 Default 0.07109 0.01508 #00ffff None 3 7425 7425-012 D2C-S-U-900-7425-012-37C 48.0 -88.1 None -90.0 0.0 0.050 4 Default 0.07050 0.01289 #00ffff None 4 7425 7425-015 D3A-F-U-900-7425-015-37C 54.0 -97.4 None -90.0 0.0 0.050 4 Default 0.07091 0.00925 #00ffff None 5 8495 8495-010 D2A-S-U-900-8495-010-37C 98.7 -80.2 None -90.0 0.0 0.050 4 Default 0.00592 0.00580 #00ffff None 6 8495 8495-012 D2C-S-U-900-8495-012-37C 104.5 -88.0 None -90.0 0.0 0.050 4 Default 0.00564 0.00562 #00ffff None 7 8495 8495-015 E1-F-U-900-8495-015-37C 108.9 -91.1 None -90.0 0.0 0.050 4 Default 0.00614 0.00059 #00ffff None 8 8495 8495-017 D3A-F-U-900-8495-017-37C 100.0 -77.9 None -90.0 0.0 0.050 4 Default 0.00563 0.01055 #00ffff None 9 8822 8822-008 D2A-S-U-900-8822-008-37C 50.9 -84.1 None 90.0 0.0 0.050 4 Default 0.03429 0.01679 #00ffff None 10 8822 8822-018 E1B-S-U-900-8822-018-45C 34.4 -72.5 None 90.0 0.0 0.050 4 Default -0.05262 -0.07409 #00ffff None
The NISTmAbInterlaboratory NMR Study 1H / 13C Data Release 1 Columns in the Meta Data Table meta.tab INDEXA unique index number for the spectrum, from 1 to 375. DIR_NAMEThe directory containing the spectrum; the directory name is the same as the Lab ID, such as “8822”. CODE A unique code name for the spectrum, consisting of the Lab ID and Measurement ID, such as “8822-037”. TITLE A text title for the spectrum, such as “D2C-S-U-900-8822-010-37C”. The title fields are: type of measurement (experiment code), sample type (S for System Suitability Sample, F for NISTmAb Fab), sampling scheme (U for uniform, N for non-uniform), spectrometer frequency in MHz, Lab ID, Measurement ID, and temperature. XP0 XP1 Zero and first order phase correction for the directly-detected (1H) dimension. Y_FTARG Sign adjustments needed to Fourier transform the indirect dimension, either “None” (no adjustment), “neg” (negate imaginaries), or “alt” (change sign of alternating points). YP0 YP1 Zero and first order phase correction for the indirect (13C) dimension. XBASE_FRAC Baseline correction was limited when possible. If this value is 1.0, correction was applied to all 1H vectors. If it is less than one, only a fraction of vectors at either edge of the spectrum were corrected. XBASE_ORD Polynomial order used for baseline correction of the directly-detected dimension. YBASE_ORDPolynomial order used for baseline correction of the indirect dimension DX_PPMAdjustment needed to calibrate the chemical shifts in the directly-detected dimension, ppm. DY_PPM Adjustment needed to calibrate the chemical shifts in the indirect dimension, ppm. COLORUsed to associate a color with a given spectrum, either as a name (like “red”) or Red-Green-Blue (RGB) hex code (like “#ff0000”). NOTE Comment about the spectrum; if there are spaces, the comment is surrounded by quotes.
The NISTmAbInterlaboratory NMR Study 1H / 13C Data Release 1 How the Processed Spectra are Organized • The original processed spectra are in the directory “study/ft”. • All spectra were processed with NMRPipe, and are in NMRPipe format. • The file names in directory “study/ft” consist of the indexnumber, the Lab ID, and the Measurement ID. The first spectrum is named “001-8822-010.ft2” and the last is named “375-9966-007.ft2”. • Because a variety of acquisition details were used, the spectra in the directory “study/ft” have different sizes and chemical shift ranges. • Directory “study/interp” contains versions of the original spectra interpolated via bi-linear interpolation, so that they all have the exact same size and chemical shift range as the first spectrum in the collection. • The file names in directory “study/interp” are based on the index number for the spectrum. The first spectrum is named “001.ft2” and the last is named “375.ft2”. • The files in directory “study/interp” are saved as an NMRPipe-format pseudo-3D data set. This means that the entire spectral collection can be accessed and viewed at once in NMRPipe’s “nmrDraw” spectral display interface, and the mouse scroll wheel can be used to move through the spectral series: • nmrDraw –in interp/%03d.ft2
The NISTmAbInterlaboratory NMR Study 1H / 13C Data Release 1 How the Spectra Were Processed • The original time-domain data and header parameters were not modified. • Solvent signal was subtracted in the time-domain by convolution difference. • Cosine-squared bell windows were used in the 1H dimension, and cosine bell windows were used in the 13C dimension. The cosine bells go from sin(0.5p) to sin(0.95p). • The 1H dimension was zero filled to 4096 complex points, and the 13C dimension to 1024 complex points. • During processing, only the region from 1H = 3.7ppm to -1.0ppm was retained. • Zero and first order phase corrections for the 1H dimension were determined automatically for ~90% of the spectra. • In cases where visual inspection indicated that the 1H dimension needed additional phase correction, phase correction was determined interactively; these cases are noted in the NOTE column of table “meta.tab”. • In most cases, the 13C dimension needed only “canonical” phase corrections, either: (P0 = +/- 90, P1 = 0) (P0 = +/- 90, P1 = 180) or (P0 = -180 +/- 90, P1 = 360). • In cases where visual inspection indicated that the 13C dimension needed additional phase correction, phase correction was determined interactively. • NUS data were reconstructed with NMRPipe’s implementation of Iterative Soft Thresholding (IST). • Each spectrum was rescaled so that the maximum intensity is 100.0.
The NISTmAbInterlaboratory NMR Study 1H / 13C Data Release 1 Baseline Correction • An attempt was made to minimize the use of baseline correction in the 1H dimension, because many results were better without it. • Because of the measurement and instrument variations, we found no single baseline correction scheme suitable for all spectra. Therefore, schemes were varied to allow only a portion of the data to be corrected, and to choose the polynomial order for correction (usually 4, 2, 1, or 0) that gave visually good results for a given spectrum. • By default, no baseline correction was applied in the 13C dimension. • In ~3 cases where 13C dimension had a first order phase correction of P1 = 360, zero-order baseline correction was applied. • In ~5 other cases, visual inspection indicated that additional baseline correction in the 13C dimension was needed, and zero-order baseline correction was applied.
The NISTmAbInterlaboratory NMR Study 1H / 13C Data Release 1 1H Selective Baseline Correction • Many spectra had strong axial artifacts at either edge of the 13C chemical shift range. So, a baseline correction scheme was used where only 5% of the 1H vectors at either edge of the spectrum were fully corrected, followed by 5% of vectors corrected according to a cosine-square roll-off scheme that applied decreasing amount of correction further from the edge. 8822-070.ft2 Before Correction After 4th Order Correction Correction Roll-Off Profile (XBASE_FRAC = 0.05) 5% of Spectral Width Roll-Off Correction 5% of Spectral Width Fully Corrected
The NISTmAbInterlaboratory NMR Study 1H / 13C Data Release 1 How the Spectra Were Auto-Phased in the 1H Dimension Spectrum 001-8822-010.ft2 (reference for chemical shift alignment) shown: First Order Phase: Minimize left side/right side difference in the region 1H 3.6 ppm to 2.6 ppm, within 13C +/- 0.25 ppm of the largest peak. Zero Order Phase: Minimize sum squared of negative intensities in the region 13C 22 ppm to 16 ppm.
The NISTmAbInterlaboratory NMR Study 1H / 13C Data Release 1 How Chemical Shift Calibrations Were Aligned • Spectrum 001-8822-010.ft2 was used as reference for chemical shift alignment. • Initial alignments were determined automatically according to 1H and 13C 1D projections. Alignments were found that minimized the sum square difference between the projection from the reference and the shifted projection from a given spectrum. • Final alignment values were determined automatically by detecting peaks in the region (1H 0.640 ppm to 0.510ppm), (13C 15.70 ppm to 14.30ppm), and setting the largest peak there to (1H 0.578 ppm, 13C 14.996 ppm). • One spectrum could not be aligned automatically because of solvent artifacts; this is noted in the meta.tab file. Reference Peak: 1H 0.578 ppm 13C 14.996 ppm
The NISTmAbInterlaboratory NMR Study 1H / 13C Data Release 1 Web-Based Viewing of the Data Collection The data distribution includes a simple web page (web/hc.html) for viewing pre-generated images of all the spectra. The interface contains a sortable scrolling list of the spectra. Clicking on a given row in the list will display the image of that spectrum. Clicking on a given column name at the top of the list will sort the list according to the values in that column.
The NISTmAbInterlaboratory NMR Study 1H / 13C Data Release 1 Example Spectra – The Good, The Bad, and The Ugly … 900 MHz System Suitability Sample
The NISTmAbInterlaboratory NMR Study 1H / 13C Data Release 1 Example Spectra – The Good, The Bad, and The Ugly … 600 MHz System Suitability Sample
The NISTmAbInterlaboratory NMR Study 1H / 13C Data Release 1 Example Spectra – The Good, The Bad, and The Ugly … Hardware-Related Artifacts
The NISTmAbInterlaboratory NMR Study 1H / 13C Data Release 1 Example Spectra – The Good, The Bad, and The Ugly … Unphaseable Signals in 1H
The NISTmAbInterlaboratory NMR Study 1H / 13C Data Release 1 Example Spectra – The Good, The Bad, and The Ugly … Unphaseable Signals in 13C
The NISTmAbInterlaboratory NMR Study 1H / 13C Data Release 1 Example Spectra – The Good, The Bad, and The Ugly … Broad Signals
The NISTmAbInterlaboratory NMR Study 1H / 13C Data Release 1 Example Spectra – The Good, The Bad, and The Ugly … Distorted Lineshapes
The NISTmAbInterlaboratory NMR Study 1H / 13C Data Release 1 Example Spectra – The Good, The Bad, and The Ugly … Pervasive Artifacts
The NISTmAbInterlaboratory NMR Study 1H / 13C Data Release 1 Animation of All 114 System Suitability US Spectra
The NISTmAbInterlaboratory NMR Study 1H / 13C Data Release 1 Animation of All 136 System Suitability NUS Spectra
The NISTmAbInterlaboratory NMR Study 1H / 13C Data Release 1 Animation of All 63 Fab US Spectra
The NISTmAbInterlaboratory NMR Study 1H / 13C Data Release 1 Animation of All 62 Fab NUS Spectra
The NISTmAbInterlaboratory NMR Study 1H / 13C Data Release 1 Some PCA Results All 375 Spectra - Direct PCA on 1H 2.0 ppm to -0.7ppm 13C 28.0 ppm to 8.0ppm Component 2 vs 3 Colored by Sample Type System Suitability Sample NISTmAb Fab
The NISTmAbInterlaboratory NMR Study 1H / 13C Data Release 1 Some PCA Results Fab Spectra Only - Direct PCA on 1H 2.0 ppm to -0.7ppm 13C 28.0 ppm to 8.0ppm Component 2 vs 3 Colored by Experiment Type
The NISTmAbInterlaboratory NMR Study 1H / 13C Data Release 1 Some PCA Results Fab Spectra Only - Direct PCA on 1H 2.0 ppm to -0.7ppm 13C 28.0 ppm to 8.0ppm Component 2 vs 3 Colored by Spectrometer Frequency
The NISTmAbInterlaboratory NMR Study 1H / 13C Data Release 1 Some PCA Results Fab Spectra Only - Direct PCA on 1H 2.0 ppm to -0.7ppm 13C 28.0 ppm to 8.0ppm Component 2 vs 4 Colored by Temperature
The NISTmAbInterlaboratory NMR Study 1H / 13C Data Release 1 Future Data Releases • Baseline correction for several spectra could be improved. There might be data updates to accommodate this. • Some spectra have systematic distortions due to hardware problems. There might be data updates to improve these spectra via processing. • Additional PCA results will be released, including updated software for performing PCA. • Scripts for the 1H / 15N data will be released separately.
The NISTmAbInterlaboratory NMR Study 1H / 13C Data Release 1 Installing NMRPipe • If you wish to use the NMRPipe processing scripts provided with the study data, you must use a version of NMRPipe downloaded 9/7/2017 or after. • The NMRPipe installation page is here (www.nmrpipe.com redirects here): • https://www.ibbr.umd.edu/nmrpipe/install.html • If you already have NMRPipe installed, you should perform a clean reinstallation, following all of these steps: • Rename or delete the existing NMRPipe installation. • Edit the .cshrcfile in your login directory to remove all NMRPipe-related initializations. If the .cshrcfile is empty, delete it (it will be recreated automatically during installation). • Log out before continuing. • For any questions about NMRPipe, contact: frank.delaglio@nist.gov
The NISTmAbInterlaboratory NMR Study 1H / 13C Data Release 1 How to Use the Master Processing Script to Re-Process Data • If you wish to use the NMRPipe processing scripts provided with the study data, you must use a version of NMRPipe downloaded 9/7/2017 or after. • The script clean.com will delete previous processed results. • The script proc.com will process the entire spectral series. If it is invoked with no other arguments, it will use the processing parameters in meta.tab, recreating the spectra in the original study data distribution. The processed results will be saved in directory study/ft as described previously. • Running proc.com will also recreate the individual processing scripts for each spectra (such as study/8822/8822-010.com). These scripts are saved along with the time-domain data, as described previously. The scripts can be edited or executed directly to make local versions of individual spectra. • The script interp.com will interpolate the processed results in the study/ftdirectory. The interpolated results will be saved indirectory study/interpas described previously. • The script show.comwill run the nmrDraw graphical interface to display the interpolated results. • For any questions about processing, contact: frank.delaglio@nist.gov
The NISTmAbInterlaboratory NMR Study 1H / 13C Data Release 1 How to Use the Master Processing Script to Re-Process Data • The script proc.com can also be used to process a subset of the data, or to process the data using different parameters such as different window functions. This will require familiarity with NMRPipe software. • To process a subset of the data, prepare a version of table meta.tab containing only the entries for the subset of spectra desired. Then use the new table as input via the –in option, for example: • proc.com –in my_meta.tab • Use the proc.com –procArgsoption to override the default processing options, to change solvent filter details, window functions, etc. Use basicFT2.com –help for more details about processing parameters. • The –procArgsoptions should be the last items on the command line. The default settings are: • proc.com –procArgs -xEXTX1 3.7ppm -xEXTXN -1.0ppm \ • -xZFARG size=4096 -yZFARG size=1024 -xSOL SOL • As an example, to process the data with an additional 15Hz Gaussian line broadening in the 1H dimension: • proc.com –procArgs–xGLB 15
The NISTmAbInterlaboratory NMR Study 1H / 13C Data Release 1 Study Authors NIST/IBBR John Marino Frank Delaglio Robert Brinson Luke Arbogast John Schiel Health Canada Yves Aubin Geneviève Gingras HoumanGhasriani Medical Products Agency (MPA-Sweden) Andreas Blomgren TorgnyRundlӧf Genentech Ken Skidmore Hoffmann-La Roche Ltd. Alfred Ross Amgen Mats Wikstrӧm John B. Jordan Biogen, Inc Julie Yu Wei EN-FIST Centra of Excellence JanezPlavec GregorIlc Brazilian Center for Research in Energy and Materials (CNPEM) Ana Carolina de MattosZeri Mauricio Luis Sforça Universitaet Bayreuth Kristian Schweimer Pacific Northwest National Laboratory (PNNL) John R. Cort Patrick N. Reardon Chad W. Lawrence Baxter Healthcare Carlos A. Amezcua Christina M. Szabo Pfizer Essential Health Edward R. Zartler Stockhom University Gӧran Widmalm Jonas Ståhle Momenta Pharmaceuticals Desiree Tsao
The NISTmAbInterlaboratory NMR Study 1H / 13C Data Release 1 Study Authors ETH-Zurich Prof. Dr. Gerhard Wider Thea Suter-Stahel The University of Queensland Mehdi Mobli XinyingJia Gregory K. Pierens Eli Lilly and Company Scott A. Bradley Medical University of South Carolina Stuart Parnham National Institutes of Natural Sciences (NINS) SaekoYanaka KoickiKato NIST Gaithersburg Anthony Kearsley Ryan Evans National Research Council of Canada Feng Ni Ping Xu Leibniz-InstitutfürmolekularePhamakologie (FMP-Berlin) Peter Schmieder Nils Trieloff Bruker BioSpin Corporation Donna M. Baldisseri The University of Melbourne David W. Keizer Hamish G. Grant FDA-CBER DarónFreedberg FDA-CDER Kang Chen David Keire
The NISTmAbInterlaboratory NMR Study 1H / 13C Data Release 1 Acknowledgements National Association of Proficiency Testing Chuck Ellis Bruker BioSpin Corporation Clemens Anklin Kim Colson Genentech Yung-Hsiang Kao NIST Gaithersburg William Wallace Harvard Medical School Gerhard Wagner HaribabuArthanari Sven Hyberts Biogen JC Hus Leibniz-InstitutfürmolekularePhamakologie Monika Beerbaum
NMRPipe is Provided by the National Institute of Standards and Technology in Partnership with the National Institutes of Health www.nmrpipe.com NMRPipe: a multidimensional spectral processing system based on UNIX pipes. Frank Delaglio, Stephan Grzesiek, Geerten. W. Vuister, Guang Zhu, John Pfeifer, and Ad Bax, J. Biomol. NMR. 6, 277-293 (1995).
NIST Disclaimer: Certain commercial equipment, instruments, and materials are identified in this presentation in order to specify the experimental procedure. Such identification does not imply recommendation or endorsement by the National Institute of Standards and Technology, nor does it imply that the material or equipment identified is necessarily the best available for the purpose.