Download

1 / 26
260 likes | 273 Vues
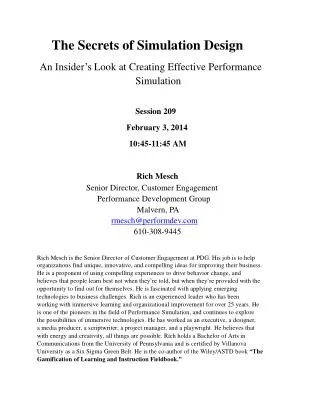
The Secrets to HCM Consistency Using Simulation Models. Given by: Ronald T. Milam, AICP Contributing Analysts: David Stanek, PE Chris Breiland Mike Iswalt. Transportation Research Board Planning Applications Conference, May 2007. Typical Simulation Examples. When to Use Simulation.

E N D
The Secrets to HCM Consistency Using Simulation Models • Given by: • Ronald T. Milam, AICP • Contributing Analysts: • David Stanek, PE • Chris Breiland • Mike Iswalt Transportation Research Board Planning Applications Conference, May 2007
When vs. How? • The HCM methodologies may not be appropriate in environments with multiple travel modes or multiple hours of congestion. • “… the HCM methods are generally not appropriate…for the evaluation of queues that are building over both time and space.” – Page 9-1, HCM 2000 • “ Certain freeway traffic conditions cannot easily be analyzed by the methodology. Multiple overlapping bottlenecks are an example. Therefore, other tools may be more appropriate…” - Page 22-1, HCM 2000
Challenges/Issues • Multiple software packages • AIMSUN • CORSIM • Dynasim • Paramics • SimTraffic • TransModeler • VISSIM • others… • Which ones are HCM consistent? • How can a user or reviewer be sure?
Simulation Performance Measures • Traffic simulation programs provide many performance measures • Total delay • Density • Travel time • Average speed • Travel distance • Number of stops • However, the definition of the performance measures may differ from the HCM definition. • Stopped delay • Throughput • Emissions • Fuel consumption • Queue length • Others
HCM Performance Measures • HCM methods determine LOS for facility types based on different performance measures • Facility Type • Intersections • Urban Streets • Two-Lane Highways • Multi-lane Highways • Freeways • Performance Measure • Control Delay • Speed • Percent Time Spent Following • Density • Density
Consistency Issues • Roadway System • Peak hour factor • Intersections • Defining the intersection approach • Freeways • Ramp influence areas
Peak 15-Minute Volume Peak Hour Peak Hour Volume Peak Hour Factor • HCM defines the LOS for the peak 15 minutes of the peak hour
Peak Hour Factor, continued… • Edit the periods file to create 15-minute interval demand periods. Paramics Example
Peak Hour Factor, continued… Use the divisor parameter in the demands file to adjust peak hour volumes. Hourly data with PHF of 0.95 implies a divisor of 3.8. Paramics Example
Maximum Queue Intersection Approach Delay • Include delay for all vehicles on approach • Model link delay may not include entire intersection approach Model Network
Intersection Approach Delay, continued… • Upstream unsignalized intersection divides the southbound approach into two links. SimTraffic Example
Intersection Approach Delay, continued… • Upstream unsignalized intersection divides the southbound approach into two links. Unsignalized Driveway Intersection Link 2 Signalized Intersection Link 1 SimTraffic Example
Intersection Approach Delay, continued… • Output report for signalized intersection shows delay for Link 1 only. SimTraffic Example
Intersection Approach Delay, continued… • Adding delay for Links 1 and 2 to get the entire southbound approach delay. SimTraffic Example • LOS ResultsLink 1Links 1 & 2 • SB Approach E / 59 F / 86 • Intersection D / 40 D / 44
Ramp Influence Area • HCM defines the ramp merge analysis area as the two right shoulder lanes plus the auxiliary lane for 1,500 feet downstream of the ramp gore • Ramp influence area does not necessarily match model links
Ramp Influence Area, continued… • Build model network to account for ramp influence area and volume collection locations. VISSIM Example
2,930 ft Ramp Influence Area 450 ft Ramp Influence Area, continued… • Ramp merge area with acceleration lane Link 191 Link 190 VISSIM Example On-Ramp
1,050 ft 450 ft Ramp Influence Area, continued… • Collect statistics for ramp influence area. VISSIM Example
Ramp Influence Area, continued… • Collect statistics by lane for each link. VISSIM Example
Across Links Across Links Across Lanes Across Lanes Ramp Influence Area, continued… • Calculate volume-weighted average density first across links, then across lanes VISSIM Example
Ramp Influence Area Ramp Influence Area, continued… • Analysis Results • LocationDensity (vpmpl)LOS • Link 190 (all lanes) 42.4 E • Link 191 (all lanes) 37.2 D • Ramp Influence Area 42.1 E Link 191 Link 190 VISSIM Example
Recommendations • FHWA - Modify NGSIM priorities to better reflect user needs • TRB - Update the HCM to provide specific guidelines for simulation software vendors and to reflect a wider range of performance measures • Software Vendors – Provide technical support and training on HOW to perform simulation modeling • Users – Invest time to understand HOW to perform simulation modeling
The Secrets to HCM Consistency Using Simulation Models Questions?