Download
1 / 21
210 likes | 337 Vues
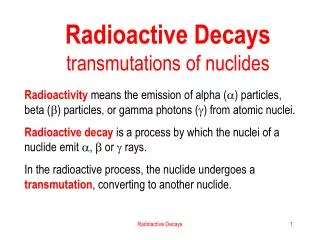
Simulating Radioactive Decays in Next Generation Geoneutrino Detectors. Megan Geen Wheaton College Advisor: Nikolai Tolich August 17, 2011. Introduction: The Earth’s Heat Production. Crust. Radius is ~6370 km Continental crust is 30 km thick Earth heat production:

E N D
Simulating Radioactive Decays in Next Generation Geoneutrino Detectors Megan Geen Wheaton College Advisor: Nikolai Tolich August 17, 2011
Introduction:The Earth’s Heat Production Crust • Radius is ~6370 km • Continental crust is 30 km thick • Earth heat production: • Geological sampling: 42 TW • Estimates from radiogenic decay: 19 TW • Radiogenic decays from: 238U, 232Th, & 40K Upper Mantle Lower Mantle Outer Core Inner Core
Introduction:Anti-Neutrinos (Geoneutrinos) • Anti-neutrinos are the antimatter counterpart to the neutrino • Comes in 3 flavors (electron, muon, tau) • Geoneutrinos are electron anti-neutrinos that come from interactions inside the Earth • Produced by beta decay: n p + e- + νe
Introduction:Anti-Neutrinos (Geoneutrinos) Crust • Neutrinos are less reactive than other particles and can make it to the crust • Can be detected by inverse beta decay: Upper Mantle Lower Mantle e+ • νe + p e+ + n α n Outer Core Inner Core νe 200 μs light time
Methods:Detector Design • Grid of NxN tubes • Each tube contains: • Liquid Scintillator • Acrylic Container • Photomultiplier tube positioned at each the end of a tube • Optical dense acrylic and an air gap separates each tube
Methods:Detector Design • Liquid scintillator creates light from charged particles within the detector • The amount of light produced is proportional to the energy of the charged particle • Design takes advantage of total internal reflection
Methods:Position Reconstruction • Position = • Δt = difference in first photon arrival at each PMT • c = speed of light in vacuum • n = index of refraction of scintillator • p0 = correction value c 1 1 (Δt)( )( ) n p0 2
Methods:Energy Reconstruction • KE = • charge = # of photons that hit the PMTs in a single tube • u = p0 + p1(x2) +p2(x4) where x is the position charge u
Methods:Energy Reconstruction • The reconstructed KE of a 1 MeV electron
Methods:Particle Identification • Depending on the particle type, KE will be found in 1 or more tubes • Our particle ID = Highest KE from all tubes Total KE Upper left has most KE = .5MeV Total KE = 1MeV ID = .5/1 = .5 Upper left has most KE = 1MeV Total KE = 1MeV ID = 1/1 = 1
Methods:Coincidence Rate • Coincidence Rate is the # of decays that look like a geoneutrino: • νe + p e+ + n (Decay Rate) x (Neutron Detection Rate) x (Time Slice) x (# of Decays in the Chain) x (Efficiency) • Coincidence Rate = Decays in a Chain: 238U=14 232Th=10 40K=1 Neutron Detection Rate: 10 (per second) Time Slice: 1x10⁻³ seconds
Analysis & Results:Simulation Suite • Each simulation consisted of 100 decays of the same type spread out within the center tube • The decays only occur within either the acrylic or liquid scintillator • Decays included: • Inverse beta • Uranium • Thorium • Potassium
Analysis & Results:Inverse Beta Decay • KE for an Inverse Beta Decay with Gd Scintillator
Analysis & Results:Inverse Beta Decay • Positrons and neutrons are distinct in identification
Analysis & Results:Inverse Beta Decay • Focus on the positron region
Analysis & Results:All Decays • Black: β- , Blue: 238U , Red: 232Th , Green: 40K
Analysis & Results:All Decays • Cut: 1MeV < KE < 3MeV & ID < .91
Analysis & Results:Efficiencies • Efficiency = # of Events Within Cut (Decay Rate) x (Neutron Detection Rate) x (Time Slice) x (# of Decays in the Chain) x (Efficiency) • Coincidence Rate Total # of Events =
Conclusions: • We expect to see ~50 geoneutrinos per year • Coincidence Rates in the scintillator is alright and problematic in the acrylic • Acrylic contains high concentrations of 238U, 232Th, & 40K • Can lower the neutron detection rate
Future Work: • Better particle identification • 2nd or 3rd highest KE tubes • Sum of KE in certain tubes • Different detector dimensions • Various heights, widths, and depths • 1 tube made of multiple smaller tubes • More processes that can occur • Interactions with Carbon • Build up of certain isotopes in the decays chains
Acknowledgments: • Advisor: Nikolai Tolich • Post-docs: Hok Seum Wan Chan Tseung & Jarek Kaspar • REU Coordinators: Alejandro Garcia & Deep Gupta • UW REU Program and the NSF