Download
1 / 29
290 likes | 439 Vues
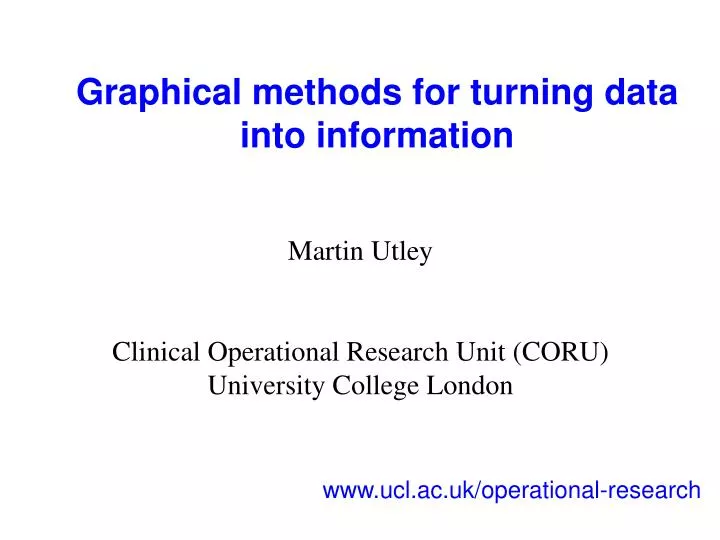
Graphical methods for turning data into information. Martin Utley Clinical Operational Research Unit (CORU) University College London. www.ucl.ac.uk/operational-research. Monitoring outcomes to improve outcomes. Data . Information system. Care process. Need to get every step right.

E N D
Graphical methods for turning data into information Martin Utley Clinical Operational Research Unit (CORU) University College London www.ucl.ac.uk/operational-research
Monitoring outcomes to improve outcomes Data Information system Care process Need to get every step right Analysis of data Feedback
Steps discussed in this talk Data Information system Care process Analysis of data Feedback
Case study 1: monitoring outcomes of cardiac surgery CORU Work done by: Steve Gallivan Chris Sherlaw-Johnson Jocelyn Lovegrove Tom Treasure Oswaldo Valencia St Georges / Guy’s
Mortality data for cardiac surgery 0000000000000000100000000 0000000000000000000000000 0000000000000100000000000 0000000100000000000000000 0000000000000000000100000 0000000000000000000001010
Mortality data for cardiac surgery 0000000000000000100000000 0000000000000000000000000 0000000000000100000000000 0000000100000000000000000 0000000000000000000100000 0000000000000000000001010 6 perioperative deaths in 150 cases
Cumulative deaths 10 8 6 4 2 0 0 20 40 60 80 100 120 140 Operation number Graphical presentation of data First used in the context of surgery by DeLeval
Cumulative deaths 10 8 6 4 2 0 0 20 40 60 80 100 120 140 Operation number Graphical presentation of data Is this series of outcomes good or bad?
Risk of perioperative death Patient factors that contribute to risk of death To be fair, assessment of outcomes should account for case-mix
Cumulative deaths 10 Expected mortality (from risk model) 8 Actual mortality 6 Par for the course 4 Net life gain 2 0 0 20 40 60 80 100 120 140 Operation number Compare outcomes to expectations
VariableLifeAdjustedDisplay(VLAD) Net life gain 5 VLAD plot for a single surgeon 4 3 2 1 0 0 20 40 60 80 100 120 140 Operation number
Comparing three fictitious surgeons Net life gain Unexpected death 5 Vlad the impaler 4 The venerable bleed 3 2 Hawkeye Pierce 1 Survivor against the odds 0 -1 -2 -3 -4 0 20 40 60 80 100 120 140 Operation number
Comparing surgeons within a unit Net life gain Operation number
+1% tail +5% +10% +25% -25% -10% -5% -1% Tools to assist interpretation Net life gain Operation number
VLAD adopted worldwide Keys to success • Surgeons say that visual display is intuitive • Can be used to identify possible problems in real time • Monitoring tool “rewards” good outcomes rather than just punish bad outcomes • Clinical champion
Case study 2: monitoring prescription errors CORU Collaborators: Steve Gallivan Christos Paschalides Bryony Dean Franklin Ann Jacklin Kara O’Grady Nick Barber Hammersmith London School of Pharmacy Funded by the Trustees of Hammersmith Hospitals NHS Trust
Monitoring the prescribing process Data Information system Junior doctor writes prescription Ward pharmacist corrects any errors that he or she identifies Care process Analysis of data Feedback
Monitoring the prescribing process Data Information system Prescription errorsdeemed sufficiently serious by pharmacist are logged as incidents Care process Analysis of data Feedback
Monitoring the prescribing process Data Information system Extensive research on nature and rates of reported prescription errors Care process Analysis of data Feedback
The problem Data Information system No systematic feedback to prescribers Care process Analysis of data With no feedback, how can we expect prescribing practice to improve?
Feasibility study ...&records consultant team, number of new orders andallerrors identified Data entered onto spreadsheet Junior doctors write prescriptions Ward pharmacist checks new medication orders... Graphical summaries prepared Feedback sent to head of specialty
Graphical summaries kept simple Your specialty Number of new orders 93 (12%) of 773 new orders 1200 had at least one error 1000 800 New medication orders with at least one error New medication orders without any errors 600 400 200 0 Specialty C Specialty
How much statistics? 95% confidence interval Specialty C
Performance over time Specialty C
Prototype feedback page 3 Comments written by the Trust’s Principal Pharmacisthighlighting any issues that arise from the data. Representative examples of prescribing errors recorded over the period.
Data Data Information Information system system Care Care process process Analysis of Analysis of data data Feedback Feedback Hang on... ...does this process lead to improvement?
Planned study Does monitoring and feedback reduce errors in the prescribing process? Error rate Time Monitor and feedback results
Summary • Succinct graphical methods can be very useful in the analysis of clinical data and in feeding back information to clinical teams. • Appropriate feedback cannot do any harm, can it? • Evaluation of monitoring systems in terms of clinical improvement is desirable.