Download
1 / 28
280 likes | 382 Vues
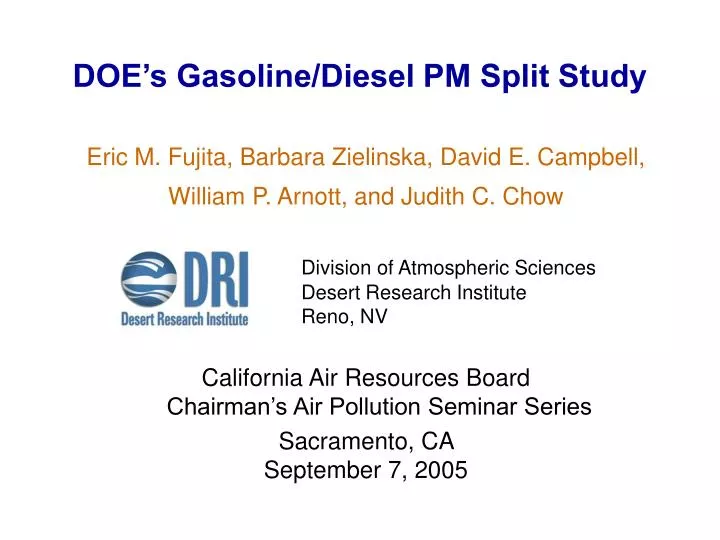
DOE’s Gasoline/Diesel PM Split Study. Eric M. Fujita, Barbara Zielinska, David E. Campbell, William P. Arnott, and Judith C. Chow Division of Atmospheric Sciences Desert Research Institute Reno, NV California Air Resources Board Chairman’s Air Pollution Seminar Series

E N D
DOE’s Gasoline/Diesel PM Split Study Eric M. Fujita, Barbara Zielinska, David E. Campbell, William P. Arnott, and Judith C. Chow Division of Atmospheric Sciences Desert Research Institute Reno, NV California Air Resources BoardChairman’s Air Pollution Seminar Series Sacramento, CA September 7, 2005
Gasoline/Diesel PM Split Study Objective: • To quantify the relative contribution of PM emissions from gasoline- and diesel-powered engines in the South Coast Air Basin • Examine range of uncertainties that may be associated with sample collection, chemical analysis and source apportionment Sources of Uncertainty and Variations in CI/SI Apportionment: • Emissions Characterization • Variability in abundance of “marker species”, normal versus high emitter • Test cycle and condition (ambient temperature) • Ambient Measurements • Spatial variations and temporal variations (diurnal, weekday and seasonal) • Atmospheric transformations • Measurement Methods • Sampling methods • Analytical methods (e.g., thermal/optical OC and EC) • Application of CMB Receptor Model • Derivation of composite profiles and uncertainties • Choice of source profiles • Choice of fitting species • Presentation of results
Vehicle Profiles – Carbon Fractions by IMPROVE-TOR Gasoline/Diesel PM Split Study, Fujita et al., 2005
Black Carbon Emissions Rates During UDC Most PM emissions during UDC from cold start and hard accels with higher fraction of black carbon. Source: Pat Arnott (2003) NREL Gas/Diesel Split Study
Fixed Site and Mobile Ambient Sampling • Downtown Los Angeles and Azusa - daily 24 hour for four consecutive weeks, composite by day-of-week • Variety of locations with variable amount of gasoline and diesel traffic Gasoline/Diesel PM Split Study
Mobile Sampling – Photoacoustic BC and DustTrak PM2.5 Parking Lot After Sporting Event Gasoline/Diesel PM Split Study
Gas Diesel PM Split Study Mobile Sampling – Photoacoustic BC and DustTrak PM2.5
Distributions of OC and EC fractions (IMPROVE) at Azusa, Los Angeles N. Main and Source Locations Gasoline/Diesel PM Split Study, Fujita et al., 2005
Scatterplot of STN-TOT EC Versus IMPROVE-TOR EC for Ambient Samples (ug/sample)
Sensitivity of CMB Apportionments to Carbon Measurement Protocol IMPROVE-TOR gave higher CI source contributions than STN-TOT. No effect on SI contributions.
Sensitivity of Apportionments to Use of EC in CMB Fit CI apportionment is dependent on EC. SI apportionment is depends on PAHs, Steranes and Hopanes rather than EC.
Emission Rates of Particulate PAH Gasoline/Diesel PM Split Study, Fujita et al., 2005
Concentrations of Particulate PAH in Lubrication Oil Samples Taken from Test Vehicles Gasoline/Diesel PM Split Study, Fujita et al., 2005
Steranes in Lubrication Oil Samples Gasoline/Diesel PM Split Study, Fujita et al., 2005
Steranes in Vehicle Exhaust Profiles Gasoline/Diesel PM Split Study, Fujita et al., 2005
Hopanes in Lubrication Oil Samples Gasoline/Diesel PM Split Study, Fujita et al., 2005
Hopanes in Vehicle Exhaust Profiles Gasoline/Diesel PM Split Study, Fujita et al., 2005
Elemental Carbon Source Contributions CI/SI (IMP) Azusa Sun – 22 WD – 19-28 Sat – 31 LANM Sun – 14 WD – 13-21 Sat – 8 CI/SI (STN) Azusa Sun – 22 WD – 17-31 Sat – 42 LANM Sun – 17 WD – 10-18 Sat – 17
Organic Carbon Source Contributions CI/SI (IMP) Azusa Sun – 4.6 WD – 2.5-3.8 Sat – 4.3 LANM Sun – 2.0 WD – 2.3-3.3 Sat – 1.5 CI/SI (STN) Azusa Sun – 1.9 WD – 1.5-2.7 Sat – 2.8 LANM Sun – 1.5 WD – 0.9-1.3 Sat – 1.3
Variations in Source Contribution Estimates (Percent of Total) Azusa and Los Angles Weekday Ambient Samples
Factors Affecting Apportionment of CI/SI Exhaust • CI apportionments were mainly dependent upon EC. CI contributions were greater with IMPROVE. • SI apportionments were most sensitive to PAHs ( indeno[123-cd]pyrene, benzo(ghi)perylene, and coronene) and steranes and hopanes. EC had little effect on SI apportionment. • EC emission for SI vehicles were minimal except in cold start and hard accels. • “Marker” PAHs were present in used SI engine lubrication oil in similar proportions but concentrations tended to increase with age of the oil. • Most of the SI apportionment was associated with the high emitter profile. Apportionment varied with specific high-emitter profile. • Removing PAHs from the fit increased SI contributions relative to CI. • CI and SI apportionments varied with location and time. • CI vehicles were the dominant mobile source of EC and TC at Azusa and LANM. • More equal apportionment at other locations that are more regionally representative. • SI vehicles were the dominant mobile source of OC and EC in locations and times with minimal truck traffic. • Alternative methods for deriving composite profiles and uncertainties had minor effect on apportionment.
Implications • Emissions of black carbon and PM were low for most SI vehicles except in cold start mode and during hard accelerations. Effect of test cycle? • CI vehicles were the dominant source of EC. EC is a reasonable surrogate of PM emissions from CI vehicles in the SoCAB. • A larger fraction of the SI source contribution to OC was attributed to high emitters. Existing control programs do not address high PM emitting vehicles. • Spatial and temporal variations in relative CI and SI apportionments were large. Must consider purpose of sampling and source apportionment (compliance with ambient standards, reconciliation with emission inventory data, exposure assessment).
Implications • PM concentrations and exposures were higher on and adjacent to major roadways with high volume of diesel truck traffic. Exposures were also higher when following high-emitting gasoline vehicles. Existing monitoring programs do not account for these higher exposures. • Motor vehicles were significant contributors to semi-volatile organic compounds. These compounds are not routinely measured. • Significant fraction of the organic carbon during summer in the SoCAB could not be apportioned to directly-emitted PM emissions from motor vehicles. What are the relative contributions of SI and CI exhaust to secondary organic aerosols?
Acknowledgments Sponsor DOE’s Office of FreedomCAR and Vehicle Technologies Dr. James Eberhardt Additional Support NREL - Study design and Coordination WVU - CI vehicle testing US EPA/BKI - SI vehicle testing BAR and SCAQMD – Light-duty vehicle recruitment Ralphs Grocery – Facility for vehicle testing

![Aircraft Vertically Separated Approaches [VSA] -Takeoffs [VST] and Split-Runway [SR] Operations](https://cdn0.slideserve.com/90694/aircraft-vertically-separated-approaches-vsa-takeoffs-vst-and-split-runway-sr-operations-dt.jpg)