Download
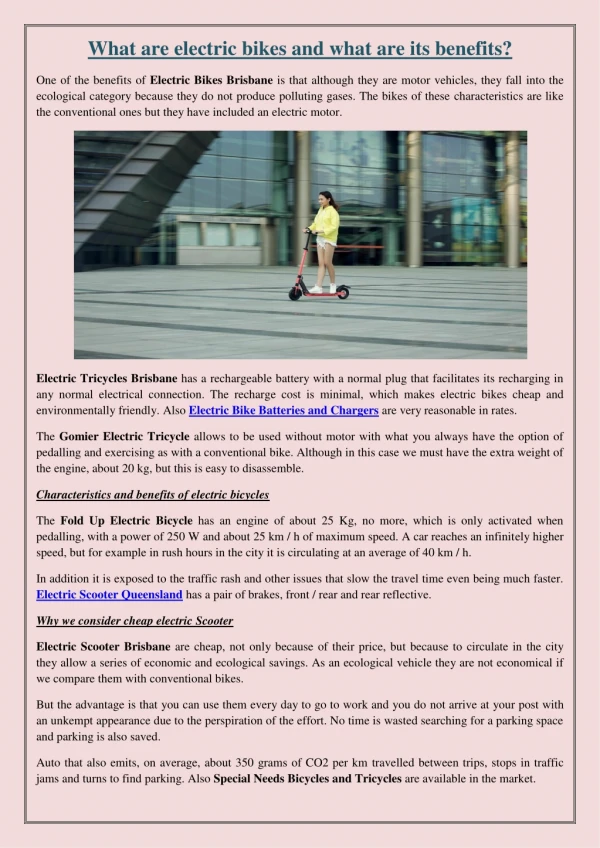
1 / 18
210 likes | 369 Vues
Walking, Biking, Electric Driving: What are the Health Benefits of Sustainable Transportation Alternatives?. Neil Maizlish, PhD, MPH, Epidemiologist California Department of Public Health Center for Chronic Disease Prevention and Health Promotion

E N D
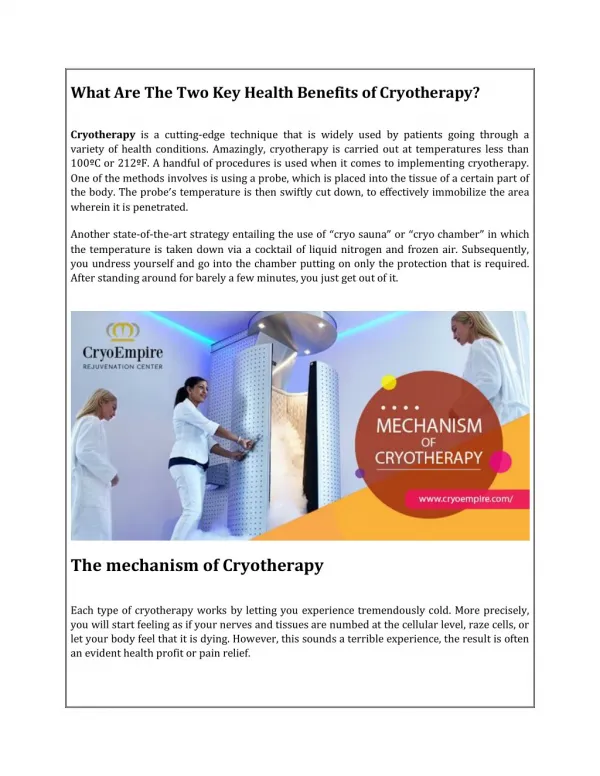
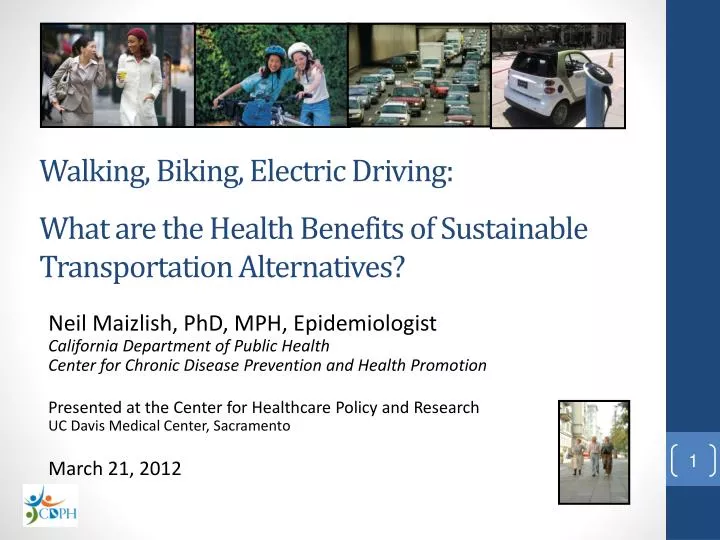
Walking, Biking, Electric Driving: What are the Health Benefits of Sustainable Transportation Alternatives? Neil Maizlish, PhD, MPH, Epidemiologist California Department of Public Health Center for Chronic Disease Prevention and Health Promotion Presented at the Center for Healthcare Policy and Research UC Davis Medical Center, Sacramento March 21, 2012
Climate Change and Public Health • Climate change no. 1 public health threat in 21st Century • California 12th largest greenhouse gas emitter in world • Transportation is the largest source of GHGs in California – 38% of total (179 MMT CO2E in 2003) • Personal passenger vehicles account for 30% (79% of 38%) • How can we reduce GHG emissions in transportation? • Increase efficiency of vehicles and fuels • Reduce vehicle miles traveled (less trips, mode switching (SOV to mass transport), walking/bicycling (active transport) ? ? ? ?
Smart Strategies Solve Multiple Problems • Strategies to reduce GHG emissions impact health • Do the strategies generate health co-benefits? Chronic Disease/ GHGs Obesity Epidemic • Do the strategies generate harms? • What strategies yield significant health co-benefits? • How do we measure this?
Groundbreaking Health Co-Benefits Research • 2009 London Study: estimated the health impacts of alternative strategies for reducing carbon dioxide emissions from transport. • Lower carbon driving • Lower carbon emission motor vehicles/fuels • Increased active travel • Replacing urban car and motorcycle trips with walking or bicycling • Shift from 10 to 30 minutes/day of walking and bicycling: • 19% Cardiovascular Disease • 15% Diabetes • 13% Breast Cancer = • 8% Dementia • 38% CO2 Emissions Dr. James Woodcock __________________ * Woodcock J, Edwards P, Tonne C, Armstrong BG, Ashiru O, Banister D, et al. Public health benefits of strategies to reduce greenhouse-gas emissions: urban land transport. The Lancet 2009;374:1930-1943.
Can the London Active Transport Model Be Adapted for Regional Transportation Plans in California? California Department of Public Health • Partner with MTC (regional MPO) and BAAQMD to apply the London model (aka ITHIM) to the Bay Area • Test the feasibility • Develop a tool kit and technical resources to assist other MPOs apply the model to their geographic area
The Model Integrates Bay Area Data on Health and Travel Physical Activity Air Pollution Traffic Injuries • Premature Deaths • Years of Life Lost • Years Living with Disability
Active Transport and Low Carbon Driving Scenarios Cities with high levels of walking and biking to work • Bay Area Benchmarks (Leading Cities) • Scenario: All Bay Area citiesachieve by 2035 the walkingand biking levels of the 2009Bay Area leaders (SF, Oakland,Palo Alto, Berkeley, Mtn. View, Rohnert Park, Morgan Hill) • Replace short car trips with active transport • 45% of 2006 Bay Area car trips were < 3 miles • 60% of car trips were < 5 mi • Scenario: 1/2 of trips <1.5 miles walked and 1/2 of trips 1.5 to 5 miles bicycled • Attaining Carbon and Physical Activity Goals (C/PAG) • Back cast the amount of active transport time and distance to reduce car VMT and increase active transport to optimum levels (no more than average commute time to work ~25 minutes); land use and infrastructure exist to support changes • Low Carbon Driving (LCD) • Fuel efficiency increases, low carbon fuels and low/no emissions cars and light trucks become more widespread, but there are no changes in physical activity or driving patterns
Daily Active Travel Times and Distances for a Typical Resident BAU = Business-as-Usual
Summary of Bay Area Scenarios: Active Transport and Low Carbon Driving Active Transport Scenarios • 2-3 fold increase in walking (2.6%-4.3% of distance mode share) • 4-16 fold increase in bicycling (2.9%-10.7% of distance mode share) • Carbon reduction goal has 15% of distance mode share from active transport • 4%-15% decrease in car VMT Low Carbon Driving • Penetration of gas-electric hybrid vehicles and light duty diesels, increased biofuels usage and the penetration of electric vehicles (Pavley I&II) • BAU/incremental changes 16.5% decrease • Electrification and biofuels (9%-33.5% decrease)
Methods for Assessing Health Outcomes for Active Transport • Comparative Risk Assessment • Disease Burden = Attributable Fraction × Disease Burden ↓ Percent change in disease rates from BAU due to shift in exposure distribution in the alternative scenario • RR is the relative risk of the health outcome at the given exposure level • For physical activity, exposure, x, is the hours per week spent in walking and bicycling (and all other physical activity), • For air pollution, exposure, x, is the concentration of fine particulate matter (PM2.5) • Burden of Disease • Disability Adjusted Life Year, DALY, is a measure of premature mortality and disability based on the years of life lost, YLL (years of expected life - age at death) + years lived with a disability, YLD DALY = YLL + YLD
Meta-analyses for Assessing Health Outcomes for Active Transport • Physical Activity • Based on strong quantitative evidence of a link between exposure pathways and health outcomes, the following health outcomes were chosen: * Metabolic Equivalent is amount of energy expended of a person at rest (1 MET = 1 kcal/kg/hr)
Health Impacts of Active Transport Scenarios * Range reflects range of physical activity in scenarios
Annual Health Benefits of Active Transport and Low Carbon Driving in the Bay Area: Predictions from the ITHIM Model Source of Health Benefit or Harm (Scenario 3: Active transport Scenario 4 15% of miles traveled)
Annual Aggregate Reductions in Passenger Vehicle Greenhouse Gas Emissions from Different Transport Scenarios 2000 Baseline27.9 MMTCO2 45% Reduction 2035 Goal # Based on car VMT*BASSTEGG emission factor * Per capita reduction of 26% † Adjusted for double counting of mode choice BAU, Business-as-Usual; LCD, Low Carbon Driving; TD, Top Decile of Cities; ATC, Active Transport Carbon Goal
Summary of Findings A shift in active transport from a median of 4.4 to 22 minutes/day (2% to 15% mode share): • Disease reductions • 14% of heart disease, stroke, and diabetes • 6-7% of dementia and depression • 5% of breast and colon cancer • Major public health impact • Adds about 9.5 months of life expectancy • $1.4 to $22 billion annual Bay Area health cost savings
Summary of Findings • Injuries • 19% of injuries to pedestrian and bicyclists • Physical activity accounts for almost all the health benefits; air pollution < 1% • ~15% reductions in CO2 emissions • Low carbon driving is not as important as physical activity for generating health co-benefits • Together, low carbon driving and active transport can achieve California’s carbon reduction goals and optimize the health of the population + =
Acknowledgments • The Team • Linda Rudolph, CDPH (conceived the project), Sacramento • Neil Maizlish, CDPH, Richmond • James Woodcock, UKCRC Centre for Diet and Activity Research (CEDAR), UK • Sean Co, Metropolitan Transportation Commission, Oakland • Bart Ostro, Centre for Research in Environmental Epidemiology (CREAL), Spain • Amir Fanai and David Fairley, Bay Area Air Quality Management District, San Francisco • Other Contributors • Caroline Rodier, Urban Land Use & Transportation Program, UC Davis • Dr. Phil Edwards and Dr. Zaid Chalabi, London School of Hygiene and Tropical Medicine • Colin Mathers, World Health Organization, Geneva • Other staff from MTC, UCD, CDPH, Mike Zdeb (University at Albany, NY) • Partial funding and grant support • The California Endowment, Oakland • Kaiser Permanente – Northern California Community Benefits Programs, Oakland • Public Health Law and Policy, Oakland, CA • Public Health Institute, Oakland
Contact Information Neil Maizlish (Neil.Maizlish@cdph.ca.gov) Report available at: http://www.cdph.ca.gov/programs/CCDPHP/Documents/ITHIM_Technical_Report11-21-11.pdf N Maizlish – 10/24/11