Download
1 / 33
330 likes | 334 Vues
Learn the fundamentals of data and statistics in economics, including data sources, descriptive statistics, statistical inference, and computer analysis. Explore applications in business, marketing, production, finance, and more.

E N D
Chapter 1 Data and Statistics I need help! Applications in Economics Data Data Sources Descriptive Statistics Statistical Inference Computers and Statistical Analysis
Applications in Economics Statistics: a methodology to use data to learn the “truth.” i.e., Uncover the true data mechanism Probability: Branch of mathematics that models of the truth In economics, we estimate and test economic models and their predictions Use empirical models for prediction, forecasting, and policy analysis.
Applications in Business • Marketing Electronic point-of-sale scanners at retail checkout counters are used to collect data for a variety of marketing research applications. • Production Statistical quality control charts are used to monitor the output of a production process.
Applications in Finance • Finance Financial advisors use statistical models to guide their investment advice.
Data, Data Sets, Elements, Variables, and Observations Variables Observation Element Names Annual Earn/ Company Sales($M) Share($) Dataram EnergySouth Keystone LandCare Psychemedics Dataram 73.10 0.86 EnergySouth 74.00 1.67 Keystone 365.70 0.86 LandCare 111.40 0.33 Psychemedics 17.60 0.13 Data Set
Data and Data Sets • Data are the facts and figures collected, summarized, analyzed, and interpreted. • The data collected in a particular study are referred • to as the data set.
Elements, Variables, and Observations • The elements are the entities on which data are collected. • A variable is a characteristic of interest for the elements. • The set of measurements collected for a particular element is called an observation. • The total number of data values in a data set is the number of elements multiplied by the number of variables.
Scales of Measurement Data Qualitative Quantitative Numerical Numerical Nonnumerical Nominal Ordinal Nominal Ordinal Interval Ratio
Scales of Measurement Scales of measurement include: Nominal Interval Ordinal Ratio The scale determines the amount of information contained in the data. The scale indicates the data summarization and statistical analyses that are most appropriate.
Scales of Measurement • Nominal Data are labels or names used to identify an attribute of the element. A nonnumeric label or numeric code may be used.
Scales of Measurement • Nominal Example: Students of a university are classified by the dorm that they live in using a nonnumeric label such as Farley, Keenan, Zahm, Breen-Phillips, and so on. A numeric code can be used for the school variable (e.g. 1: Farley, 2: Keenan, 3: Zahm, and so on).
Scales of Measurement • Ordinal The data have the properties of nominal data and the order or rank of the data is meaningful. A nonnumeric label or numeric code may be used.
Scales of Measurement • Ordinal Example: Students of a university are classified by their class standing using a nonnumeric label such as Freshman, Sophomore, Junior, or Senior. A numeric code can be used for the class standing variable (e.g. 1 denotes Freshman, 2 denotes Sophomore, and so on).
Scales of Measurement • Interval The data have the properties of ordinal data, and the interval between observations is expressed in terms of a fixed unit of measure. Interval data are always numeric.
Scales of Measurement • Interval Example: Average Starting Salary Offer 2003 Economics/Finance: $40,084 History: $32,108 Psychology: $27,454 Econ & Finance majors earn $7,976 more than History majors and $12,630 more than Psychology majors. Source: National Association of Colleges and Employers
Scales of Measurement • Ratio The data have all the properties of interval data and the ratio of two values is meaningful. Variables such as distance, height, weight, and time use the ratio scale. This scale must contain a zero value that indicates that nothing exists for the variable at the zero point.
Scales of Measurement • Ratio Example: Econ & Finance majors salaries are 1.24 times History major salaries and are 1.46 times Psychology major salaries
Qualitative and Quantitative Data Data can be qualitative or quantitative. The appropriate statistical analysis depends on whether the data for the variable are qualitative or quantitative. There are more options for statistical analysis when the data are quantitative.
Qualitative Data Labels or names used to identify an attribute of each element. E.g., Black or white, male or female. Referred to as categorical data Use either the nominal or ordinal scale of measurement Can be either numeric or nonnumeric Appropriate statistical analyses are rather limited
Quantitative Data Quantitative data indicate how many or how much: Discrete, if measuring how many. E.g., number of 6-packs consumed at tail-gate party Continuous, if measuring how much. E.g., pounds of hamburger consumed at tail-gate party Quantitative data are always numeric. Ordinary arithmetic operations are meaningful for quantitative data.
Cross-Sectional Data Cross-sectional data observations across individuals at the same point in time. Example: the growth rate from 1960 to 2004 of each country in the world (about 182 of them). Example: wages for head of household in Indiana
Time Series Data Time series data are collected over several time periods. Example: the sequence of U.S. GDP growth each Year from 1960 to 2005 Example: the sequence of Professor Mark’s wage each year from 1983 to 2005.
Data Sources • Existing Sources Within a firm – almost any department Business database services – Dow Jones & Co. Government agencies - U.S. Department of Labor Industry associations – Travel Industry Association of America Special-interest organizations – Graduate Management Admission Council Collect your own
Data Sources • Statistical Studies • In experimental studies variables of interest • are identified. Then additional factors are • varied to obtain data that tells us how • those factors influence the variables. In observational (nonexperimental) studies we cannot control or influence the variables of interest. a survey is a good example
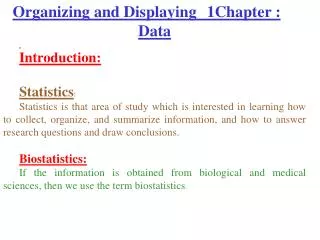
Descriptive Statistics • Descriptive statistics are the tabular, graphical, and numerical methods used to summarize data.
Example: Hudson Auto Repair The manager of Hudson Auto would like to understand the cost of parts used in the engine tune-ups performed in the shop. She examines 50 customer invoices for tune-ups. The costs of parts, rounded to the nearest dollar, are listed on the next slide.
Example: Hudson Auto Repair • Sample of Parts Cost for 50 Tune-ups
Tabular Summary: Frequency and Percent Frequency Parts Cost ($) Percent Frequency Parts Frequency 2 13 16 7 7 5 50 4 26 32 14 14 10 100 50-59 60-69 70-79 80-89 90-99 100-109 (2/50)100
18 16 14 12 10 8 6 4 2 Graphical Summary: Histogram Tune-up Parts Cost Frequency Parts Cost ($) 50-59 60-69 70-79 80-89 90-99 100-110
Numerical Descriptive Statistics • The most common numerical descriptive statistic • is the average (or sample mean). • Hudson’s average cost of parts, based on the 50 • tune-ups studied, is $79 (found by summing the • 50 cost values and then dividing by 50).
Statistical Inference Population - the set of all elements of interest in a particular study Sample - a subset of the population Statistical inference - the process of using data obtained from a sample to make estimates and test hypotheses about the characteristics of a population Census - collecting data for a population Sample survey - collecting data for a sample
Process of Statistical Inference 1. Population consists of all tune-ups. Average cost of parts is unknown. 2. A sample of 50 engine tune-ups is examined. 3. The sample data provide a sample average parts cost of $79 per tune-up. 4. The sample average is used to estimate the population average.