Download
1 / 49
490 likes | 633 Vues
Star F ormation R ate and N eutral G as C ontent as a F unction of R edshift and E nvironment. Philip Lah. Collaborators: Mike Pracy, Jayaram Chengalur, Frank Briggs, Matthew Colless Galaxy Metabolism: Galaxy Evolution N ear and F ar 2009.

E N D
Star Formation Rate and Neutral Gas Content as a Function of Redshiftand Environment Philip Lah Collaborators: Mike Pracy, Jayaram Chengalur, Frank Briggs, Matthew Colless Galaxy Metabolism: Galaxy Evolution Near and Far 2009
Star Formation Rate Density Evolution Compilation by Hopkins 2004
Galaxy HI Mass vs Star Formation Rate HIPASS & IRAS data z ~ 0 Doyle & Drinkwater 2006
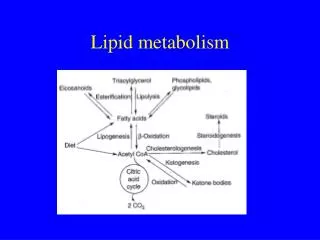
HI Gas Density Evolution Not a log scale
HI Gas Density Evolution Prochaska et al. 2005 & 2009 DLAs Lah et al. 2007 coadded HI 21cm Rao et al. 2006 DLAs from MgII absorption Zwaan et al. 2005 HIPASS HI 21cm
DEC RA The Fujita Galaxies Subaru Field 24’ × 30’ narrow band imaging Hα emission at z = 0.24 (Fujita et al. 2003, ApJL, 586, L115) 348 Fujita galaxies 121 redshifts using AAT GMRT ~48 hours on field
Star Formation Rate Density Evolution Compilation by Hopkins 2004
Star Formation Rate Density Evolution Fujita et al. 2003 value Compilation by Hopkins 2004
HI spectrum all Fujita galaxies coadded HI spectrum using 121 redshifts - weighted average raw
HI spectrum all Fujita galaxies coadded HI spectrum using 121 redshifts - weighted average raw MHI = (2.26 ± 0.90) ×109 M binned
HI Gas Density Evolution Lah et al. 2007 coadded HI 21cm
Galaxy HI Mass vs Star Formation Rate HIPASS & IRAS data z ~ 0 Doyle & Drinkwater 2006
HI Mass vs Star Formation Rate at z = 0.24 all 121 galaxies line from Doyle & Drinkwater 2006
HI Mass vs Star Formation Rate at z = 0.24 42 bright L(Hα) galaxies 42 medium L(Hα) galaxies 37 faint L(Hα) galaxies line from Doyle & Drinkwater 2006
Abell 370, a galaxy cluster at z = 0.37 • large galaxy cluster of order same size as Coma • similar cluster velocity dispersion and X-ray gas temperature • optical imaging ANU 40 inch telescope • spectroscopic follow-up with the AAT • GMRT ~34 hours on cluster HI z = 0.35 to 0.39 Abell 370 cluster core, ESO VLT image
Abell 370 galaxy cluster Abell 370 galaxy cluster 324 galaxies 105 blue (B-V 0.57) 219 red (B-V > 0.57)
HI mass 324 galaxies 219 galaxies 105 galaxies 94 galaxies 156 galaxies 168 galaxies 110 galaxies 214 galaxies
HI mass 324 galaxies 219 galaxies 105 galaxies 94 galaxies 156 galaxies 168 galaxies 110 galaxies 214 galaxies
HI mass 324 galaxies 219 galaxies 105 galaxies 94 galaxies 156 galaxies 168 galaxies 110 galaxies 214 galaxies
HI mass 324 galaxies 219 galaxies 105 galaxies 94 galaxies 156 galaxies 168 galaxies 110 galaxies 214 galaxies
HI mass 324 galaxies 219 galaxies 105 galaxies 94 galaxies 156 galaxies 168 galaxies 110 galaxies 214 galaxies
Galaxy HI Mass vs Star Formation Rate HIPASS & IRAS data z ~ 0 Doyle & Drinkwater 2006
HI Mass vs Star Formation Rate in Abell 370 all 168 [OII] emission galaxies Average line from Doyle & Drinkwater 2006
HI Mass vs Star Formation Rate in Abell 370 81 blue [OII] emission galaxies Average line from Doyle & Drinkwater 2006 87 red [OII] emission galaxies
Why is there a dramatic evolution in theCosmic Star Formation Rate Density and only minimal evolution in theCosmic HI Gas Density?
Evolution of HI Gas in Galaxies Vol Vol Vol log(SFR) log(MHI) SFR = a (MHI)m HI = MHI SFRD = SFR SFRD = a × (MHI)m m ~ 1.7 at z = 0 (Doyle & Drinkwater 2006)
Evolution of HI Gas in Galaxies Vol Vol Vol log(SFR) log(MHI) SFR = a (MHI)m HI = MHI SFRD = SFR SFRD = a × (MHI)m m ~ 1.7 at z = 0 (Doyle & Drinkwater 2006)
Evolution of HI Gas in Galaxies Vol Vol Vol log(SFR) log(MHI) SFR = a (MHI)m HI = MHI SFRD = SFR SFRD = a × (MHI)m m ~ 1.7 at z = 0 (Doyle & Drinkwater 2006)
Evolution of HI Gas in Galaxies Vol Vol Vol log(SFR) log(MHI) SFR = a (MHI)m HI = MHI SFRD = SFR SFRD = a × (MHI)m m ~ 1.7 at z = 0 (Doyle & Drinkwater 2006)
Evolution of HI Gas in Galaxies Vol Vol Vol log(SFR) log(MHI) SFR = a (MHI)m HI = MHI SFRD = SFR SFRD = a × (MHI)m m ~ 1.7 at z = 0 (Doyle & Drinkwater 2006)
Downsizing • the stellar populations of the most massive galaxies formed at early times (Heavens et al. 2004, Thomas et al. 2005 & others) • the sites of active star formation shift from the high-mass galaxies at earliest times to the lower-mass galaxies at later periods (Cowie et al. 1996, Gunzman et al. 1997 & others) • high-mass galaxies with active star formation highest HI gas content?
Downsizing • the stellar populations of the most massive galaxies formed at early times (Heavens et al. 2004, Thomas et al. 2005 & others) • the sites of active star formation shift from the high-mass galaxies at earliest times to the lower-mass galaxies at later periods (Cowie et al. 1996, Gunzman et al. 1997 & others) • high-mass galaxies with active star formation highest HI gas content?
Downsizing • the stellar populations of the most massive galaxies formed at early times (Heavens et al. 2004, Thomas et al. 2005 & others) • the sites of active star formation shift from the high-mass galaxies at earliest times to the lower-mass galaxies at later periods (Cowie et al. 1996, Gunzman et al. 1997 & others) • high-mass galaxies with active star formation highest HI gas content?
SKA pathfinders • large field of view • ASKAP 30 deg2 (focal plane array) • MeerKAT 1.2 to 4.8 deg2 (1420 to 700 MHz) • frequency coverage out 700 MHz HI redshift z = 1.0 • optical redshift surveys • ASKAP use WiggleZ • MeerKAT use zCOSMOS and others
Conclusion • used coadded HI 21-cm emission to measure the cosmic HI gas density at z = 0.24; value is consistent with that from damped Lyα measurements; shown SFR–MHI relationship holds at z = 0.24 • galaxies around Abell 370 at z = 0.37 have significantly amounts of gas; shows clear environmental trends similar to nearby systems; shown SFR–MHI relationship holds at z = 0.37 • to explain difference in evolution between SFR and HI gas postulated either a varying SFR–MHI relationship or a varying HI mass function
Conclusion • used coadded HI 21-cm emission to measure the cosmic HI gas density at z = 0.24; value is consistent with that from damped Lyα measurements; shown SFR–MHI relationship holds at z = 0.24 • galaxies around Abell 370 at z = 0.37 have significantly amounts of gas; shows clear environmental trends similar to nearby systems; shown SFR–MHI relationship holds at z = 0.37 • to explain difference in evolution between SFR and HI gas postulated either a varying SFR–MHI relationship or a varying HI mass function
Conclusion • used coadded HI 21-cm emission to measure the cosmic HI gas density at z = 0.24; value is consistent with that from damped Lyα measurements; shown SFR–MHI relationship holds at z = 0.24 • galaxies around Abell 370 at z = 0.37 have significantly amounts of gas; shows clear environmental trends similar to nearby systems; shown SFR–MHI relationship holds at z = 0.37 • to explain difference in evolution between SFR and HI gas postulated either a varying SFR–MHI relationship or a varying HI mass function