Download
1 / 23
230 likes | 235 Vues
a convective case in summer 2003 seen from NOAA satellites. Satellite Data in the Verification of Model cloud forecasts. HiRLAM mini workshop on clouds and convection. Christoph Zingerle. Tartu, 24. – 26. Jan. 2005. Outline. - Verification: Alignments for Satellite Data.

E N D
a convective case in summer 2003 seen from NOAA satellites Satellite Data in the Verification of Model cloud forecasts HiRLAM mini workshop on clouds and convection Christoph Zingerle Tartu, 24. – 26. Jan. 2005
Outline - Verification: Alignments for Satellite Data - Satellite Data - Case studies - Outlook / Future HiRLAM mini workshop, Tartu 24. – 26. Jan. 2005
Verification Comparing Observations to Forecast - Observation and forecast are on different scale / location - Point measurements – volumes / fields - Problems verifying fields of meteorological data e.g. rain, clouds, radar reflectivity HiRLAM mini workshop, Tartu 24. – 26. Jan. 2005
Verification HiRLAM mini workshop, Tartu 24. – 26. Jan. 2005
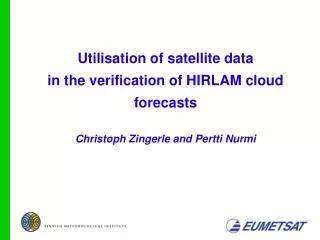
temperature humidity cloud fraction cloud liquid water cloud ice water total cloud water surface data (p, T, rH) - Simulates clear/cloudy multilevel infrared and microwave radiances RTTOV-8 - Consistent random-overlap scheme for clouds in different levels - Multiphase cloud field: water / ice / mixed HiRLAM mini workshop, Tartu 24. – 26. Jan. 2005 Verification
HiRLAM mini workshop, Tartu 24. – 26. Jan. 2005 Satellite Data
NOAAAVHRR satellite image - Re-sampling needed - Preprocessed AVHRR image (calibrated and navigated) pixel center in the grid-box corresponding to the HIRLAM grid pixel assigned to this grid-box HiRLAM mini workshop, Tartu 24. – 26. Jan. 2005 Satellite Data - Assumptions: HIRLAM grid value represents average over all the values in box Neighbouring pixels tend to have similar properties
full resolution, 30.4.2004 (10.8µ) after re-sampling, 30.4.2004 (10.8µ) HiRLAM mini workshop, Tartu 24. – 26. Jan. 2005
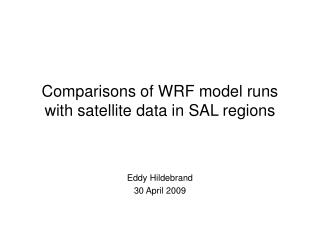
15. – 17. July 2005 MODEL: SATELLITE DATA: - Forecasts re-run at ECMWF in May 2004 with reference HiRLAM of last summer. - Smalldomain covering little more than Scandinavia - All NOAA satellite observations of that periode - Irregular distribution (time and space) of the satellite overpasses HiRLAM mini workshop, Tartu 24. – 26. Jan. 2005 Convective Case
HiRLAM mini workshop, Tartu 24. – 26. Jan. 2005 Convective Case
HiRLAM mini workshop, Tartu 24. – 26. Jan. 2005 Convective Case all observations convection observed surface / clear sky
HiRLAM mini workshop, Tartu 24. – 26. Jan. 2005 Convective Case
HiRLAM mini workshop, Tartu 24. – 26. Jan. 2005 Convective Case morning
HiRLAM mini workshop, Tartu 24. – 26. Jan. 2005 Convective Case
HiRLAM mini workshop, Tartu 24. – 26. Jan. 2005 Convective Case afternoon
HiRLAM mini workshop, Tartu 24. – 26. Jan. 2005 Convective Case afternoon
HiRLAM mini workshop, Tartu 24. – 26. Jan. 2005 Convective Case night
HiRLAM mini workshop, Tartu 24. – 26. Jan. 2005 Convective Case afernoon 2 (+34h)
HiRLAM mini workshop, Tartu 24. – 26. Jan. 2005 Evolution histogram
HiRLAM mini workshop, Tartu 24. – 26. Jan. 2005 Evolution histogram
Satellite Data: - RTM’s are a very useful tool also in verification - Up / Dowonscaling methods have to be tested more extensively (true observation?) - Continuous observations are needed - Convective clouds in model general to warm – convection not strong enough? - Higher surface temperatures observed than forecasted - Advected clouds have smaller differences - Error decompostion needed! (postion, area, intensity) HiRLAM mini workshop, Tartu 24. – 26. Jan. 2005 Conclusions
- This case: more forecasts – more details (lead time) - Continuous observations – METEOSAT 7/8 - Adaption of error decompostion software - Satellite / SYNOP comparison HiRLAM mini workshop, Tartu 24. – 26. Jan. 2005 Future