Download
1 / 50
510 likes | 625 Vues
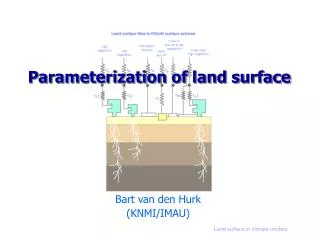
Interpreting land surface features. SWAC module 3. Different kinds of image. Panchromatic image True-color image False-color image. Part I: EMR & satellite images. EMR : NASA – Echo the bat. Remember the EM energy spectrum.

E N D
Interpreting land surface features SWAC module 3
Different kinds of image • Panchromatic image • True-color image • False-color image
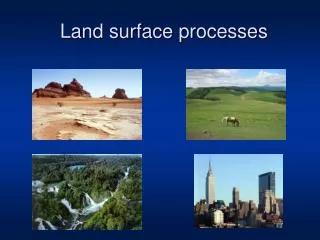
Remember the EM energy spectrum • All objects emit radiation based upon their temperature (IR) and reflective properties (Vis) • Poor reflectors of solar energy (water) appear dark or black in VISIBLE imagery • In IR imagery, water will appear varying shades of gray based on water temperature. • During the course of a day, the land heats up with land areas becoming darker in IR imagery, while the ocean is constant temperature through the day. • Snow and ice are good reflectors and appear white or bright gray in Visible and medium to bright gray in IR (cold). Remember clouds move - snow cover doesn’t • Forested areas show up darker in Visible imagery (trees limit albedo of snow cover)…forests are generally less reflective of solar energy than open fields. Consider the Adirondack forest region.
Electromagnetic spectrum • divided into different spectral bands (visible light, NIR, microwave) given its wavelength • every object reflects or emits radiation = signature • signatures recorded by remote-sensing devices • use of different parts of spectrum • visible • infrared • microwave
Sensors record intensity of reflected energy numerically
The amount of the reflected energy or intensity is recorded for each pixel, in each band or wavelength, on a scale of 0-255.
1 2 3 4 7 5 6 Visible Infrared 3,2,1 Green Data is shown as Green Blue Data is shown as Blue Red Data are shown as Red
Sensor senses some segment of the Electromagnetic Spectrum • Reads the “spectral signature” of the surface that is reflecting/emitting light
Electromagnetic Radiation Every material on earth reflects uniquely in each wavelength when it is exposed to electromagnetic radiation (visible light and “invisible light”, such as infrared or ultraviolet rays). Also, when the material gets hot, it radiates at a unique strength in each wavelength. This figure shows the strength of reflection and radiation from plants, earth and water in each wavelength. The horizontal axis shows wavelength, left side is shorter and right side is longer.
Seeing (infra)Red Chlorophyll strongly absorbs radiation in the red and blue wavelengths but reflects green wavelengths. (This is why healthy vegetation appears green.) The internal structure of healthy leaves act as excellent diffuse reflectors of near-infrared wavelengths. Measuring and monitoring the near-IR reflectance is one way that scientists can determine how healthy (or unhealthy) vegetation may be. Anita Davis & Jeannie Allen
NIR, high reflectance 0.5 very high leaf area 0.4 very low leaf area 0.3 sunlit soil reflectance(%) 0.2 Visible green, higher than red 0.1 Visible red, low reflectance 0.0 400 600 800 1000 1200 Wavelength, nm Spectral information: vegetation
Vegetation characteristics • high reflectivity in NIR • - distinguish between vegetation types on basis of spectral reflection curves
Spectral signature Explain why water looks darkish blue; Explain why vegetation looks greenish; Explain why sand looks reddish yellow
Tools used in photointerpretation • tone or colour • texture • pattern • shape • shadow • size • situation
Tone and Color • - amount of energy reflected/emitted from the scene in a given wavelength/band • - each wavelength/band of EMR recorded by the sensor can be displayed in shades of grey from black to white • - these shades are called “tones” – dark, light, intermediate • - human eye can see 40-50 tones Jensen (2000)
Tone and colour • variations in tone and colour results in all of the other visual elements • we associate specific tones to particular features • tones change when we enhance an image or when we change the band combination of a color image
Texture Jensen (2000)
Texture • related to frequency of tone changes which give the impression of roughness or smoothness of image features • arrangement of tone or colour in an image • smooth (uniform, homogeneous), intermediate, and rough (coarse, heterogeneous)
Texture and Pattern • varies with image resolution • often noted by roughness or smoothness • influenced by shadows
Pattern • = spatial arrangement of objects in image • general descriptions include random and systematic; natural and human-made. • more specific descriptions include circular, oval, curvilinear, linear, radiating, rectangular, etc. Gregory Vandenberg
Pattern Jensen (2000)
Shape • = general form or outline of an object • - helped by shadows Jensen (2000)
Size and Shape • Rectangular features often indicate human influence such as agriculture • Size and shape information greatly influenced by image resolution • Knowing the scale of the image helps to convert feature dimensions on the image to actual dimensions
Relative and Absolute Location • the location of a feature narrows the list of possible cover types • relative location particularly useful to determine land use
Shadows • often considered a contaminant but can be very useful to identify features on an image • helpful to accentuate relief • shadow effects change throughout the day and throughout the year • shadows can give an indication to the size of a particular feature
Shadow Jensen (2000)
Landsat Thematic Mapper Imagery Band Wavelength Applications • 0.45 to 0.52 Blue Distinguishing soil from vegetation, water penetration, deciduous vs. conifers • 0.52 to 0.60 Green Determining plant vigor (reflectance peak) 3 0.63 to 0.69 Red Matches chlorophyll absorption-used for discriminating vegetation types. 4 0.76 to 0.90 Near IR Refl IR - biomass content. • 1.55 to 1.75 Short Wave IR Refl IR - Indicates moisture content of soil and veg., cloud/smoke penetration, veg. mapping. 6 10.40 to 12.50 Thermal IR Geological mapping, soil moisture, thermal pollution monitoring, ocean current studies. 7 2.08 to 2.35 Short Wave IR Ratios of bands 5 & 7 used to map mineral deposits.
True Color compositeRGB = 3,2,1 Visible bands are selected and assigned to their corresponding color guns to obtain an image that approximates true color. Tends to appear flat and have low contrast due to scattering of the EM radiation in the blue visible region.
Palm Springs, CA Bands 3,2,1 (red, green, blue)
Landsat ETM+ bands 4,3,2 – Peak chlorophyll, land/water boundary, urban areas Landsat ETM+ bands 3,2,1 – Penetrates shallow water and shows submerged shelf, water turbidity
Near Infra Red CompositeRGB = 4,3,2 • Blue visible band is not used and the bands are shifted; • Visible greensensor band to the blue color gun • Visible red sensor band to the green color gun • NIR band to the red color gun. • results in the familiar NIR composite with vegetation portrayed in red.
Digital Image Display Band 4 (0.7-0.9 m) Band 3 (0.55-0.7 m) RGB:432 (False Color Composite) Band 2 (0.45-0.55 m)
Palm Springs, CA Bands 4, 3, 2 (NIR, red, green)
Identifying vegetation conifers stress deciduous
1973-76 2000 Monitoring Ecosystem Changes Gradual changes require long-term, repeat satellite coverage • Landsat data are used to: • Precisely assess the area affected • Separate human from natural causes • Bridge the gap between field observations and global monitoring Loss of wetlands in Mesopotamia (dark red areas) since 1973 from Landsat. Courtesy Hassan Partow, UNEP
Quantifying Water and Energy Budgets Will future water supplies meet human needs? 1973 ARAL SEA • By 2025, 48% of global population will live in “water stressed” basins (<1700 m3/pers/yr) 1987 2000 Water flux into the Aral Sea is being diverted for human use Courtesy WRI
New England ice storm – False colour composite vs. actual storm totals
Depending upon the band combination and colors assigned, land cover appears in various colors.
Suggested class activities • Mapping change over time (e.g. before and after an eruption) • Monitoring changing fall foliage (senescence) • Using Google Earth to make deductions (photointerpretation)
Uses of Remote Sensing Satellite imagery allows for remote sensing of and detection of changes in: • Clouds and weather • Snow and ice coverage • Rivers and Lakes • Forests vs Urban areas • Changes in Tropical Rain Forests • Ocean coastlines and sea height