Download

1 / 15
150 likes | 160 Vues
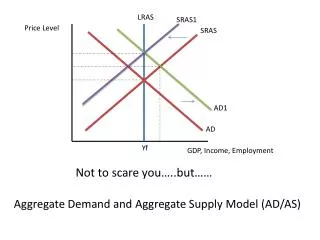
MODULE 18 Aggregate Supply: Introduction and Determinants. How the aggregate supply curve illustrates the relationship between the aggregate price level and the quantity of aggregate output supplied in the economy What factors can shift the aggregate supply curve

E N D
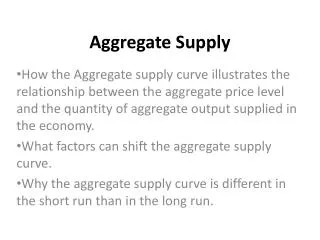
How the aggregate supply curve illustrates the relationship between the aggregate price level and the quantity of aggregate output supplied in the economy • What factors can shift the aggregate supply curve • Why the aggregate supply curve in the short run is different from the aggregate supply curve in the long run
Aggregate Supply • The aggregate supply curve shows the relationship between the aggregate price level and the quantity of aggregate output in the economy.
The Short-Run Aggregate Supply Curve • The price level and the aggregate supply curve have positive association. Why? • Profit = Price - Cost • Answer depends on whether the price the producer receives for a unit of output is greater or less than the cost of producing that unit of output. • The short-run aggregate supply curve is upward-sloping because nominal wages are sticky in the short run: • a higher aggregate price level leads to higher profits and increased aggregate output in the short run. • The nominal wage is the dollar amount of the wage paid. • Sticky wages are nominal wages that are slow to fall even in the face of high unemployment and slow to rise even in the face of labor shortages.
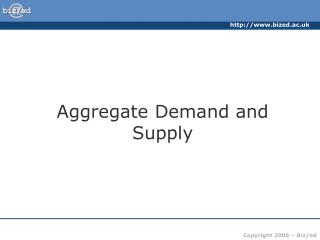
The Short-Run Aggregate Supply Curve Aggregate price level (GDP deflator, 2005 = 100) Short-run aggregate supply curve, SRAS 10.6 1929 A movement down the SRAS curve leads to deflation and lower aggregate output. 7.9 1933 $716 Real GDP (billions of 2005 dollars) 0 977
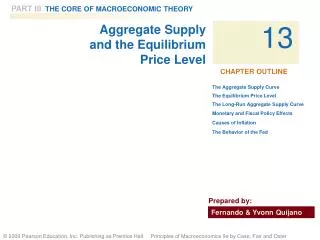
Shifts of the Short-Run Aggregate Supply Curve (b) Rightward Shift (a) Leftward Shift Aggregate price level Aggregate price level SRAS SRAS 1 2 SRAS SRAS 1 2 Decrease in short-run aggregate supply Increase in short-run aggregate supply Real GDP Real GDP
Shifts of the Short-Run Aggregate Supply Curve • Changes in commodity prices, nominal wages, or productivity lead to changes in producers’ profits and shift the short-run aggregate supply curve. • A commodity is a standardized input bought and sold in bulk quantities, such as oil, coffee, or copper. • Commodities are not final goods.
Long-Run Aggregate Supply Curve • The long-run aggregate supply curve shows the relationship between the aggregate price level and the quantity of aggregate output supplied that would exist if all prices, including nominal wages, were fully flexible.
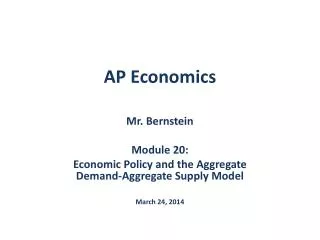
Long-Run Aggregate Supply Curve Long-run aggregate supply curve, LRAS Aggregate price level (GDP deflator, 2005 = 100) 15.0 …leaves the quantity of aggregate output supplied unchanged in the long run. A fall in the aggregate price level 7.5 Real GDP (billions of 2005 dollars) 0 $800 Potential output, YP
S R AS 2 S R AS 2 A fall in nominal wages shifts SRAS rightward. A rise in nominal wages shifts SRAS leftward. From the Short Run to the Long Run (a) Leftward Shift of the Short-Run Aggregate Supply Curve (b) Rightward Shift of the Short-Run Aggregate Supply Curve Aggregate price level Aggregate price level L R AS L R AS S R AS 1 S R AS 1 A1 A1 P P 1 1 Y Y Y Y Real GDP Real GDP P 1 1 P
The aggregate supply curve shows the relationship between the aggregate price level and the quantity of aggregate output supplied. • The short-run aggregate supply curve is upward sloping because nominal wages are sticky in the short run. • Changes in commodity prices, nominal wages, and productivity lead to changes in producers’ profits and shift the short-run aggregate supply curve. • In the long run, all prices are flexible and the economy produces at its potential output, and the long-run aggregate supply curve is vertical at potential output.