Download
1 / 12
120 likes | 242 Vues
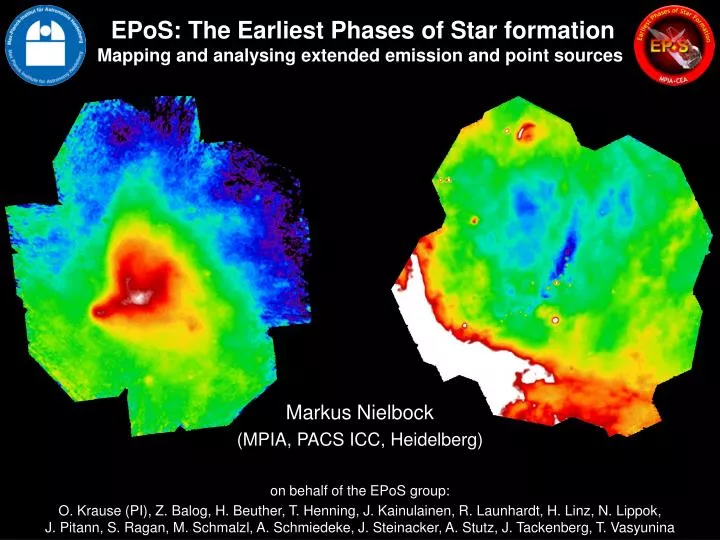
EPoS : The Earliest Phases of S tar formation Mapping and analysing extended emission and point sources . Markus Nielbock ( MPIA , PACS ICC, Heidelberg) on behalf of the EPoS group:

E N D
EPoS: The Earliest Phases of Star formation Mapping and analysing extended emission and point sources Markus Nielbock (MPIA, PACS ICC, Heidelberg) on behalf of the EPoS group: O. Krause (PI), Z. Balog, H. Beuther, T. Henning, J. Kainulainen, R. Launhardt, H. Linz, N. Lippok,J. Pitann, S. Ragan, M. Schmalzl, A. Schmiedeke, J. Steinacker, A. Stutz, J. Tackenberg, T. Vasyunina
EPoS: The Earliest Phases of Star formation • Herschel guaranteed time key programme (112 hours, PI: O. Krause, MPIA) • to map well studied cloud cores across the entire mass range (no blind survey) • separated into a low (12 cores) and a high-mass (45 regions) part • to determine the dust temperature and density distribution of 12 near and isolatedlow-mass cores (e.g. Stutz et al. 2010, Nielbock et al. 2012, Launhardtet al. 2013) • to characterise the embedded core populations of 45 high-mass SF regions and IRDCs(e.g. Beuther et al. 2010, 2012, Henning et al. 2010, Linz et al. 2010, Ragan et al. 2013, Pitann et al. 2013) • used PACSand SPIRE bolometers at 70, 100, 160, 250, 350, and 500 µm • small (< 10’) and deep (6 and 30 reps per map) to be sensitive for extended emission,PACS and SPIRE in prime observing mode (opposite to Gould Belt, HiGal surveys) • added ground-based (sub)mm and NIR extinction data • http://www.mpia.de/IRSPACE/herschel/epos
Observational setup • no parallel mode • spatial distortion of point sources (scanning speed, on-board averaging) • digitisation noise of faint extended emission (bit rounding in parallel mode) • small but deep maps • just large enough to assess background emission (isolated low-mass cores) • small map pixel size at 70 µm (high spatial coverage/sampling) B 68 IRDC 316.72 Gould Belt Survey 100 µm 160 µm EPoS 70 µm HiGal 70 µm EPoS 100 µm 160 µm EPoS – HiGalEPoS / HiGal
Data reduction • identical for both EPoS branches • standard L1 processing (incl. 2nd level/map deglitching) • branched out to Scanamorphos/IDLfor processing to L2(settings: galactic, noglitch, nzdata=‘yes’) • highpass filter + photProject (PACS) unsuitable for extended emission • Mad Map had issues with point sources; pre-processing of signal drifts not deterministic(much better now) • At that time: Scanamorphos best compromise between recovering faint extended emission and, at the same time, resolving point sources • Scanamorphos was applied to all PACS and SPIRE data to maintain consistency, but the decision was mainly driven by the PACS data quality. • alternative mappers too late; changing would break consistency with already publishedresults
Data reduction B 68 HPF (100), photProject Scanamorphos present-day Mad Map PACS 100 µm PACS 160 µm
Data reduction IRDC 316.72 HPF (100), photProject Scanamorphos present-day Mad Map PACS 70 µm PACS 160 µm
Data analysis – extended emission • Final goal: to derive dust temperature and particle density maps • convolved data to same resolution; regridded maps to same pixel size using IDL(Aniano et al. 2011, circularised convolution kernels) • background subtraction using identical area in each map • ideally: to model background (zodiacal, cirrus, cosmic), but turned out to be negligible Nielbock et al. (2012)
Data analysis – extended emission • spatially resolved SED fitting (Launhardt et al. 2013) • only correct for single T component along LoS(averaging effect) • employed ray-tracing algorithm withfunctional relationship for radial density distributionusing GILDAS (Plummer-like profile, cf. Whitworth & Ward-Thompson 2001) • RT fit yields central Tdust = 8 K, smaller by 2 K than withLoSaveraged SED fitting Nielbock et al. (2012)
Data analysis – PSF photometry • target regions located in complex environmentswith high dynamic range • compact emission sources • on top of structured extended emission • embedded within extinction structures • aperture photometry unreliable PSF photometry(Starfinder/ IDL; easy to use, other tools not available/reliable/validated at that time) • PSFtemplates reproduced from Vesta calibration observations (not circularised) • PSF template rotated to match position angle of observation(rotation angle = position angle as given in metadata, counter clockwise) • Iterative approach: • run starfinder on unsharp-masked version of science data to detect point sources • detection list as input for PSF fitting and photometry on original science data
Data analysis – PSF photometry G79.31+0.36 (Cygnus Rift) • originalPACS 70 µm map • IRDC with embedded point sources • H II region to the SE • LBV shell to the NW LBV IRDC H II (DR 15) • point sources detected with IDLstarfinder • false detections in LBV shell and H II region • all visible point sources in the IRDCdetected • altogether 496 confirmed point sources in 45 IRDCs • (Ragan et al. 2012) • background image with point sources removed
Data analysis – PSF photometry • One goal: characterise embedded core population Ragan et al. (2012) • core sizes: 0.05 – 0.3 pc • core luminosities: 0.1 – 104 L • core masses: 0.1 – a few 103 M • core temperatures: 13 – 30 K
Summary • EPoS designed to investigate galactic low/high mass star forming sites • rather high S/N and structure/point source detection instead of large fieldsPACS/SPIRE individually instead of parallel mode • data reduction aimed at doing equally well for extended emission and point sources standard L1 processing in HIPE + Scanamorphosin IDL • resulted in high quality maps suitable for fitting dust properties resolved dust T and n distributions of isolated low-mass cores • resulted in high point source detection rate (469) in 45 complex high-mass SFR IRDCscatalogue and characterisation of cores embedded in IRDCs • Generally, Herschel mapping data are of very high quality for achieving EPoS goals. • Possible improvements worth reprocessing: • better noise handling (faint extended emission, detection of even fainter sources) • corrections for pointing jitter and improved PACSFPG characterisation(smaller FWHM, consolidation of flux calibration, revise source associations)