Download

1 / 43
440 likes | 826 Vues
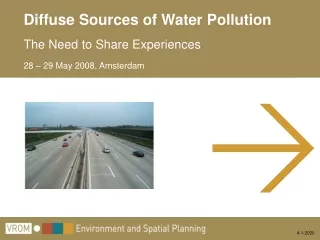
Diffuse pollution of groundwater in urban areas. David Lerner, Nigel Tait and Brenda Chisala Catchment Science Centre University of Sheffield. …and thanks to our funders, NERC, EPSRC, EA. With thanks to Mike Rivett, Yuesuo Yang, Mike Barrett and other colleagues. Outline. The message:

E N D
Diffuse pollution of groundwater in urban areas David Lerner, Nigel Tait and Brenda Chisala Catchment Science CentreUniversity of Sheffield …and thanks to our funders, NERC, EPSRC, EA With thanks to Mike Rivett, Yuesuo Yang, Mike Barrett and other colleagues
Outline • The message: • Multiple urban sources ≡ diffuse pollution • Outline: • Urban recharge • Urban groundwater pollution • Nitrate loads in Nottingham • Organic sources and risks • Summary
Precipitation Evapo-transpiration Evaporation Roofs Surface runoff Storm sewers Directrecharge Sewer leakage Roofsoakaways Infiltrationsystems Urban pathways for precipitation Urban recharge Lerner, 2002, Hydrogeology Journal, 10, 143-152
Consumptiveuse Importedwater supply Sewers Localgroundwater Irrigationexcess Septictanks Mainsleakage Sewer leakage Urban supply pathways Urban recharge Lerner, 2002, Hydrogeology Journal, 10, 143-152
Water supply and rainfall to selected cities Urban recharge
Urban recharge, Nottingham Urban recharge Yang et al. 1999, Environmental Geology, 38, 183-198
Chlorinated solvents in urban groundwater Urban groundwater pollution Rivett et al. 1990, Journal of Hydrology, 113, 307-323 Burston et al. 1993, Journal of Hydrology, 149, 137-161
Sewage in groundwater, Meadows, Nottingham Urban groundwater pollution • Meadows, like all UK urban areas, is fully sewered Barrett et al. 1999. Water Research. 33(14), 3083-3097
Road salt in groundwater Urban groundwater pollution Howard & Haynes, 1993 Geoscience Canada,20, 1-8Howard & Beck, 1993 JCH, 12, 245-268
N in Nottingham groundwater Urban groundwater pollution
Sheffield Meadows Nottingham Nottingham case study Nitrate loads in Nottingham
1 0 0 N Groundwater level 0 1 8 0 2 150 4 0 1 0 River 9 0 Multi-levelsampler 1 1 0 3 1 Mercia Mudstone 0 7 Triassic Sandstone Meadows 0 6 0 5 L. Magnesian Lst. 0 4 20 Glacial drift Alluvium 0 3 Nottingham 2 0 1 0 0 1 0 2 0 Km Hydrogeological map of Nottingham Nitrate loads in Nottingham
Cl:N:SO4 Cl:N:SO4 Cl:N:SO4 Recharge rates from solutes Sewers WaterMains Rain Cl:N:SO4 Nitrate loads in Nottingham
No Conceptual aquifer model Calibratedheads? Yes Groundwater flow model TOTALRECHARGE START Transport models for Cl, SO4, N Calibratedconcentrations? Yes No Change flowmodel? No Yes De-convolute RECHARGESLOADS Process for estimating recharge and loads Nitrate loads in Nottingham
20 km N-S 16 km W-E standard spacing 500m 1 layer MODFLOW &MT3Din Visual MODFLOW River Leen River Trent Time and space division of 4 mass balance models Nitrate loads in Nottingham
N loads to Nottingham groundwater • 1990s urban load 21 kg/ha/y • Comparable to intensive arable load • Where from? Nitrate loads in Nottingham
Urban fertilisers Nitrate loads in Nottingham Wakida & Lerner, 2005, Water Research, 29 3-16
Leaking sewers Nitrate loads in Nottingham
Septic tank systems Nitrate loads in Nottingham Wakida & Lerner, 2005, Water Research, 29 3-16
Housing and house building Nitrate loads in Nottingham
Industrial use and spillage Nitrate loads in Nottingham
2000 mg/l N 150 1800 Farm Borehole T4 Field Well 1600 100 Factory Monitoring Ponds BH T3 1400 T2 14 Former Abstraction Coking BH Plant 50 Yard Well Drain Groundwater Lagoon head 1200 Former Colliery Pit Head Large Lagoon Ammonium Spoil Heap concentration 10 1000 200 400 600 800 1000 1200 1400 1600 1800 1 Ammonium plume from Rexco Nitrate loads in Nottingham
Landfills • NH4 in leachate up to 1500 mg/l • >10 000 closed landfills in UK, mostly unlined • Loads up to 4000 kg N/ha/y Nitrate loads in Nottingham
N loads in Nottingham Nitrate loads in Nottingham Wakida & Lerner, 2005, Water Research, 29 3-16
Organic sources and risks • Density of sources • National • Nottingham • Risks from urban sources • Nottingham • Loads Organic sources
Sheffield Nottingham London Density of chlorinated solvent users Densityscale:sites/km2 • 75 000 current sites • London - 2,500 dry cleaning outlets Organic sources Tait et al. 2004, SOTTE 319, 77-98
Potential TCE sources in Nottingham 1991 Unconfined aquifer How dense a pattern to become diffuse pollution? Potential TCE sources Nottingham: point or diffuse sources? Organic sources
Sources Pathways Receptor Risk analysis for urban groundwater Organic sources
Groundwater flow model Catchment zone tool Landuse analysis Databases Pollution risk model BOS: the model components GUI Organic sources Tait et al., 2004, Environmental Modelling and Software, 19, 1111-1124
Stochastic MODPATH 1 particle per node Monte Carlo simulations E.g., recharge, permeability Frequency of arrival givesprobability of node in capture zone The catchment zone model Organic sources
Landuse GIS Organic sources
Specific industry databases Organic sources
New unconfined catchment Raw predicted catchment Probability contoured catchmentwith industries Confined Unconfined Organic sources New borehole Industries Existing borehole
The pollution risk component Organic sources • Monte Carlo analysis
Predicted concentrations Organic sources
Validation • Risk models are rarely validated • Construct and believe • Attempted validation against field data • 2 wells 14 (not independent) • 7 contaminants measurements • Also national MTBE observations (not shown) Organic sources
13/14 predictions within a factor of 2 Validation Organic sources bql = below quantification limit
50%ile log(CPCE), 2005 Borehole Simulation Location Study Area Predicted PCE concentrations Organic sources Tait et al., submitted, Environmental Modelling and Software
Risks from leaking sewers • Nottingham sewer network • Stochastic distribution of leaks • Related to sewer age • Total leakage ≡ 10 mm/y • Amended pollution risk model • Bacterial sorption and die-off Organic sources
Tame Aquifer Valley boundary Borehole and catchment Unconfined Birmingham Fault aquifer Confined aquifer Industrial area 0 4 km Chlorinated solvent load in Birmingham aquifer Assume: • Steady state • Boreholes are pumping representative concentrations of TCE, PCE, etc 1 from Rivett et al. 2005 QJEGH 38, 337-250 Organic sources
Reminder of the story • Urban recharge • plenty in cities • Urban groundwater pollution • N, organics, sewage, salt, etc • Nitrate loads in Nottingham • 21 kg/ha/yr from contaminated land, sewers, mains • Organic sources and risks • Many sources, significant risks • The message: • Multiple urban sources ≡ diffuse pollution Summary
Selected Nottingham references M.H. Barrett, K.M. Hiscock, S. Pedley, D.N. Lerner, J.H. Tellam and M.J. French, 1999. Marker species for identifying urban groundwater recharge sources – a review and case study in Nottingham UK. Water Research. 33(14), 3083-3097. Y. Yang, D.N. Lerner, M.H. Barrett, and J.H. Tellam, 1999. Quantification of groundwater recharge in the city of Nottingham, UK. Environmental Geology, 38(3), 183-198. D.N. Lerner, 2002. Identifying and quantifying urban recharge: a review. Hydrogeology Journal, 10(1), 143-152. D.N. Lerner, 2003. Estimating urban loads of nitrogen to groundwater. Journal of the Chartered Institution of Water and Environmental Management. 17(4), 239-244. N. G. Tait, R. M. Davison, J. J. Whittaker, S.A. Leharne and D. N. Lerner, 2004. Borehole Optimisation System (BOS) - A GIS based risk analysis tool for optimising the use of urban groundwater. Environmental Modelling and Software, 19, 1111-1124. F.T. Wakida & D.N. Lerner, 2005. Non-agricultural sources of groundwater nitrates: a review and case study. Water Research, 39, 3-16. F.T. Wakida & D.N. Lerner, 2006. Potential nitrate leaching to groundwater from house building. Hydrological Processes, 20(9):2077-2081. B.N. Chisala, N.G. Tait and D.N. Lerner,in press . Evaluating the risk of methyl tertiary- butyl ether (MTBE) to urban groundwater at city scale: Nottingham case study. Journal of Contaminant Hydrology, December 2005. N. G. Tait, R. M. Davison, S. A. Leharne and D. N. Lerner. Borehole Optimisation System (BOS) - Assessing the Potential Value of Urban Groundwater in Nottingham. Submitted, January 2006. Also papers led by R Taylor, K Powell and S Trowsdale. Summary