Download
1 / 25
250 likes | 329 Vues
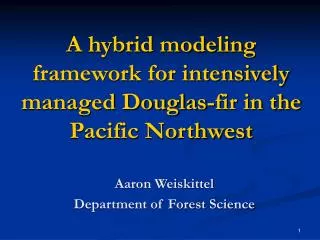
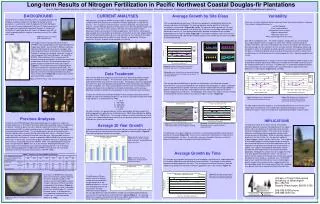
A Young Douglas-fir Plantation Growth Model for the Pacific Northwest. Nick Vaughn University of Washington College of Forest Resources. Outline. Current status of the model A review of the datasets Model details Predictive abilities Timeline. Current Status.

E N D
A Young Douglas-fir Plantation Growth Model for the Pacific Northwest Nick Vaughn University of Washington College of Forest Resources
Outline • Current status of the model • A review of the datasets • Model details • Predictive abilities • Timeline
Current Status • Have a model form for height growth • Base function with H0 and SI as predictors • Modifiers for Density, Relative height and Veg • Choosing between forms for DBH • Similar to the height growth function • Can somewhat predict changes of Veg • Just started, still need to test
Data review • Two datasets • SMC Type III (5/6 of the data) • RVMM project • Different design, but similar measurements • All Conifers measured • Multiple measurements • Veg cover optically estimated on subplots • Both are missing a lot of data on Veg treatments
Data review • Some differences • SMC data is from designed experiment • RVMM from real-world stands • Hardwoods treated different • RVMM data has only one remeasure (2-year) • RVMM veg measured in same year as trees
Data review • Fitting model using data with associated Veg measures for each tree measurement • Heights measured at both beginning and end of period • Site Index computed on stands using last measurements, • Some < age suggested for such calculations (~10 years) • Useable tree-growth observations • RVMM: 4591 • SMC: 24320
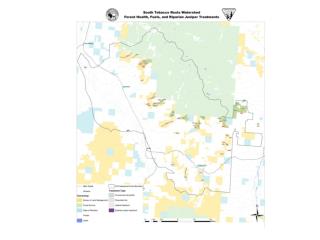
x RVMM Coastal x RVMM Cascade x SMC Type III
Data review • Range of stand ages
Model Details • Height growth model: where: is 1-year Height growth (ft) is initial Height (ft) is Top-height of the plot (ft) is Site Index (Flewelling’s curves, base=30) is Trees per acre is plot Shrub cover (%)
Model Details • Height growth model – Veg. modifier: • At low Htop: More vegetation = less growth • As Htop increases, this effect goes to 0
Model Details • Height growth model – Density modifier: • At low Htop: More density = more growth • As Htop increases, effect lessens. • After Htop reaches about 26 feet: More density = less growth
Model Details • Height growth model – Relative height mod: • Relative height = heighti/Htop • Lower relative ht. = less growth • As Htop and/or Density increase, this effect gets stronger
Model Details • Diameter growth model: where: is 1-year Diameter growth (in) is initial Diameter (in) is Top-height of the plot (ft) is Site Index is Basal Area per acre is Trees per acre is plot Shrub cover (%)
Model Details • Shrub vegetation dynamics model: where: is 1-year Veg cover change (%) is initial Shrub Vegetation cover (%) is Top-height of the plot (ft) is Site Index is Trees per acre is Basal Area per acre
Predictive Abilities • Height growth model: R2 = 0.578
Predictive Abilities • Diameter growth model: R2 = 0.590
Timeline • “Finish” modelling by June • Done = satisfied with results • Write-up done and defend by August • Coding is already underway.