Download
1 / 6
80 likes | 273 Vues
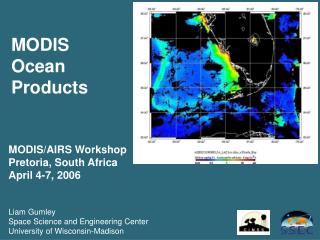
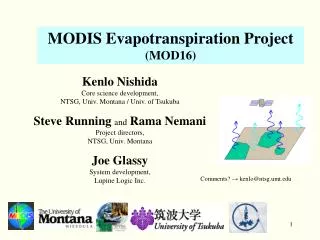
MODIS Global Evapotranspiration Products. Qiaozhen Mu, Maosheng Zhao, Steven W. Running Numerical Terradynamic Simulation Group (NTSG), College of Forestry & Conservation, The University of Montana, Missoula. 2011 Evapotranspiration Workshop April 5, 2011. Silver Spring, MD, USA.

E N D
MODIS Global Evapotranspiration Products Qiaozhen Mu, Maosheng Zhao, Steven W. Running Numerical Terradynamic Simulation Group (NTSG), College of Forestry & Conservation, The University of Montana, Missoula 2011 Evapotranspiration Workshop April 5, 2011. Silver Spring, MD, USA
Daily Meteorological data (MET) (S↓ , VPD, Temperature. No Prcp!) Input MODIS data (RS) (Albedo, FPAR/LAI, Land cover) Penman-Monteith equation ET=f (RS, MET) MODIS ET: soil evaporation, evaporation from intercepted water by canopy and plant transpiration. Mu et al., 2007, RSE; Mu et al., 2011. RSE. Mu et al., 2009, WRR
Validations at 46 AmeriFlux towers Observed average ET: 1.34 mm/day Average bias: -0.05 mm/day (Tower-meteorology-driven) 0.02 mm/day (MERRA GMAO/NASA-driven) MERRA GMAO-driven Tower-meteorology-driven R=0.84 R=0.86 Abs_bias: 0.30 mm/day Abs_bias: 0.34 mm/day
Validations at Global Watersheds Assumption: soil water is at equilibrium in a long term (>=five years). Pseudo ET observations = Annual precipitation - stream flow Distribution of the 232 watersheds. Average annual MODIS ET vs. pseudo ET (ET OBS) at the 232 watersheds over 2000-2006
Global annual 1-km ET over 2000-2010 Global average MODIS ET over vegetated land surface is 575.9 ± 381.6 mm yr-1.
Qiaozhen Mu: qiaozhen@ntsg.umt.edu 8-day, monthly, annual 1-km MOD16 ET Products (2000-2010): ftp://ftp.ntsg.umt.edu/pub/MODIS/Mirror/MOD16/ MOD16 ET products will be on USGS LP DAAC soon.