Download
1 / 23
260 likes | 540 Vues
Applications of Spatial Statistics in Ecology. Introduction. Why Space?. All entities geographers / ecologists study are located in space Knowledge of spatial location gives us two main pieces of information: Explicit physical location of an object

E N D
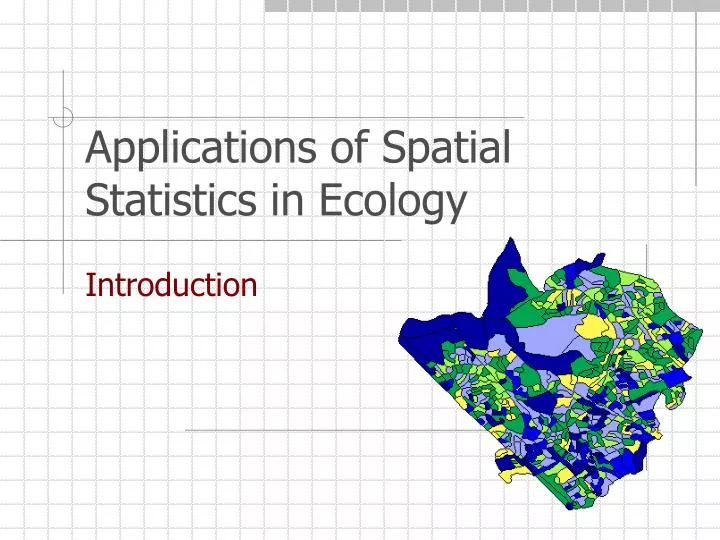
Applications of Spatial Statistics in Ecology Introduction
Why Space? • All entities geographers / ecologists study are located in space • Knowledge of spatial location gives us two main pieces of information: • Explicit physical location of an object • Whether those objects vary in a particular way across space
Spatial data exists at various scales • Applications of spatial statistics can be found at all levels of ecological inquiry • At large scales data can be gathered by remote sensing and is used in fields such as landscape ecology, rangeland ecology, ecosystem ecology • At microscopic scales data may be molecular and may be used in epidemiology and genetics • All statistical procedures which takes space into consideration are based on one simple principle: that there is a spatial pattern to observations
Ecological Levels of Analysis Landscape Level What is Landscape Ecology? • Landscape ecology is best defined by its focus on spatial heterogeneity and pattern formation in large areas • The agents of pattern formation include the physical abiotic template, demographic responses to this template, and disturbance regimes overlaid on these
Landscape Level Detecting and characterizing pattern at the landscape level • At what scale does spatial heterogeneity or pattern become apparent? (scaling techniques) • What is a “patch” and how can we describe groups of patches? • Can you think of processes at the landscape level that could be studied with spatial approaches?
Patches • Patches are defined as discrete entities in themselves: woodlots, ponds, fields, lakes • Pattern analysis can be used to summarize the differences between or among study areas or landscapes • Pattern analysis can also be used to infer underlying agents of pattern formation
What are spatial statistics? • Spatial statistics take the spatial dependence of entities into consideration • They can be used to visualize spatial data • They can be used to explore spatial dependence and how entities change across space • They can be used to model relationships in an explicitly spatial framework
Why do we need them? • Classical statistics assume that observations are independent both in space and time • This assumption is violated in most ecological data • Spatial statistics can either remove this dependence from data so that classical statistics can be used OR relationships can be modeled using an explicitly spatial approach
Spatial Analysis: Classes of Spatial Data • Point Patterns – location of an event such as trees in a forest or bird nests in a tree • Continuous Data – events that changes across space such as gradients of precipitation or salinity • Area Data – data that can be separated into zones that differ in intensity such as density or number of species within an area
Types of spatial “effects” • All spatial approaches relate to either first-order or second-order effects • First-Order Effects – relate to variation in the mean value of a process over space • Second-Order Effects – relate to the spatial correlation or spatial dependence in the process
Example of all three types of spatial data point pattern area data continuous processes
Area and Point Data Area data exists when an event has a mean value over a defined area. Area data an be created from point data
Lattice Data • Area Data is not simply zones • Areas have centroids which are used in creating spatial weight matrices
Continuous Data • Continuous data can be any event that varies in a continuous way over space • Rainfall patterns, soil moisture or pH, temperature, distributions or plants or animals
Scale is LENGTH • Spatial relationships -- and especially spatial pattern -- are obvious only at a particular scale of reference • That is, pattern is scale-dependent. Scale refers strictly to the length scale of measurement,i.e., to the length of a side of your grid cell or sampling window • Other components of scale include:
Grain and Extent • Grain or resolution refers to the fineness of distinctions recorded in the data, and may be quadrat size, or grid cell size (pixel size in imagery). • Extent refers to the domain over which measurements are recorded, and typically is the size of the study area (or GIS coverage, or image).
Why are grain and extent important? • Grain and extent are usually inversely correlated • Fine-grained measurements often cannot be made over a large extent • Scale matters because quantitative relationships in data vary as a function of grain and extent • Variables that are important over a small extent may "average away" when observed over a larger area • Knowing the scale (length, grain and extent) at which the measure is important as correlations may change in magnitude and even sign as a function of scale
Scale and Pattern • The scale, grain and extent of observations can change the patterns we observe in nature • Patterns can be: • Homogenous “the same at any point” of observation • Heterogeneous “change depending on the point you choose to observe”
Types of Patterns Patterns can also be: • Random-- distributions that have no ordered pattern in space (very few patterns are truly random – scale of observation may be inappropriate) • Clumped – distributions that are concentrated in certain areas i.e. animals around a watering hole, • Ordered – distributions that have a underlying pattern that is spaced out in a regular order
Summary: Spatial Statistics, Scale and Patterns • First-order effects – variation in the mean value of an event….is there a TREND? • Second-order effects – spatial dependence of those events….deals with PAIRS OF POINTS • Spatial data includes point patterns, continuous data and area or lattice data • Scale, grain and extent of observation often determine the type of pattern: random, clumped, dispersed that will be observed