Download
1 / 48
490 likes | 789 Vues
Positive vs. Normative Statements. Positive Statements – statements that describe the world as it is. “A rise in consumer incomes will lead to a rise in the demand for new cars.” “A fall in the exchange rate will lead to an increase in exports overseas.”

E N D
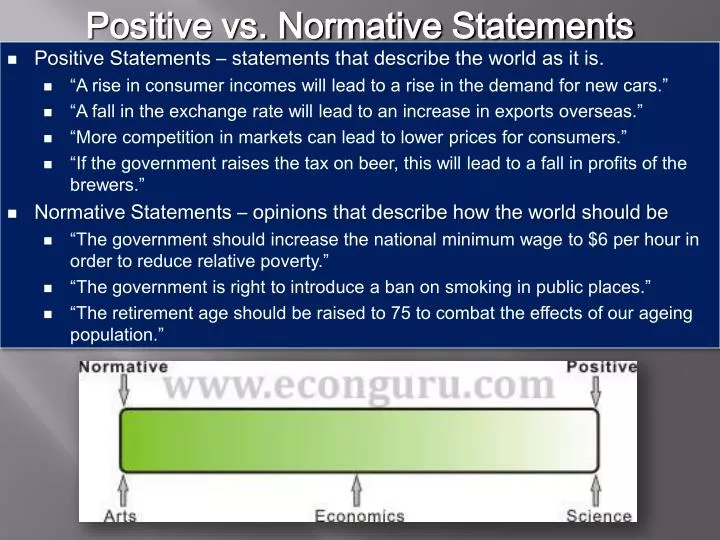
Positive vs. Normative Statements • Positive Statements – statements that describe the world as it is. • “A rise in consumer incomes will lead to a rise in the demand for new cars.” • “A fall in the exchange rate will lead to an increase in exports overseas.” • “More competition in markets can lead to lower prices for consumers.” • “If the government raises the tax on beer, this will lead to a fall in profits of the brewers.” • Normative Statements – opinions that describe how the world should be • “The government should increase the national minimum wage to $6 per hour in order to reduce relative poverty.” • “The government is right to introduce a ban on smoking in public places.” • “The retirement age should be raised to 75 to combat the effects of our ageing population.”
Chapter 2 – Thinking Like an Economist • Macroeconomics – study of the performance, structure, behavior and decision-making of the economy as a whole • Microeconomics – study of the decisions of individuals; households and firms and their interaction • Economics is a science • Devise theories, collect and analyze data, make assumptions • Economic Models – diagrams, graphs and equations used to represent human behavior and economic theory
Factors of Production • Factors of Production - resources required to produce economic products, goods and services • Land • Labor • Capital • Entrepreneurship
Land • Land – natural resources not created by human effort that are used to produce goods and services • The "gifts of nature". • Examples: Forests, fish, oil, gas, cattle, etc…
Labor • Labor – time and effort that a person devotes to producing goods and services. • Labor resources are those provided by the body and minds of men and women. • Examples: doctors, teachers, construction workers, etc...
Capital • Capital – resource that is used to produce additional goods and services • Capital is the machinery or tools that workers use to transform natural resources into finished products. • Examples: machines, computers, tablets, etc…
3 Types of Capital • Physical Capital – also known as Capital Goods, human made objects used to create other goods and services • Examples: Machines, phones, computers, equipment • Human Capital –skills, abilities, and specialized talents of people • Examples: College, training, technical school, etc. • Financial Capital – money, used by entrepreneurs and businesses to buy what they need to produce their goods or services • Examples: money
Entrepreneurs • Entrepreneurs – ambitious business people who organize the factors of production to create new goods and services • Entrepreneurs are the "risk takers" who produce a good or service that they believe will succeed in the marketplace.
Goods • Good – physical, tangible(touchable) product • i.e. – Automobiles, Video Games, Cell Phones, CD’s, Tickle Me Elmo, etc…
Services • Service – a non-tangible action or activity that is performed for someone else • i.e – Financial Advisor, Stock Broker, Movies, Dentist, Teachers, etc..
Needs vs. Wants • Need – a basic requirement for survival • e.g. – food, clothing, education, etc… • Want – not a basic requirement for survival; a means of expressing a need • e.g. – cheeseburger, Abercrombie and Fitch, University of Georgia, etc… OR
Classify the Factors of Production in the following scenario: • You decide to order a pizza to satisfy your wants. First, you picked up the telephone and gave your order to the owner that entered it into her computer. The information came up on the chief baker’smonitor in the kitchen and he assigned it to one of his cooks. The cook cook used his knowledge of mixing dough out of salt, flour, eggs, and milk. The cook finished mixing dough, washed his hands in the sink, and prepared your pizza using tomato sauce, cheese, and sausage. He then placed the pizza in the oven. Within 10 minutes the pizza was cooked and placed in a cardboard box. The delivery person then grabbed your pizza, jumped in the company car, and delivered it to your door.
Classify the Factors of Production in the following scenario: Owner _________________________________ Computer _________________________________ Chief baker’s monitor _________________________________ Kitchen _________________________________ Cooks _________________________________ Knowledge of mixing dough _________________________________ Salt, flour, eggs, and milk _________________________________ Sink _________________________________ Tomato sauce, cheese, and sausage _________________________________ Oven _________________________________ Cardboard box _________________________________ Delivery person _________________________________ Company car _________________________________ Entrepreneur Physical Capital Physical Capital Physical Capital Labor Human Capital Land Physical Capital Land Physical Capital Physical Capital Labor Physical Capital
Households and Firms • Household – Person or group of people living in a residence; consumers of goods/services • Firm – business organization that uses resources (inputs) to produce a product, which it then sells
Product Markets • Product Markets – Houses and firms interact; producers sell their goods and services to consumers • Ebay, Amazon, the mall, McDonalds, Babies R Us, etc. • Households are buyers of goods and services • Firms are sellers of goods and services
Factor Markets • Factor Markets – the markets where productive resources (F.O.P) are bought and sold • Labor - Firms (businesses) hire workers and pay them salaries • Land - Purchase/rent land • Capital - Use money from households (spending,investment, etc) to purchase capital goods
Circular-Flow Diagram • Circular-flow diagram – visual model of a free market economy simplified into households and firms communicating in the factor and product markets • Shows how dollars and stuff flows in an economy from households to firms and vice versa.
Circular Flow Model - shows the flow of money and inputs/outputs from and to firms and households in a market economy Consumer Spending Business Revenue Product Market Consumer Goods and Services Purchased Goods and Services (outputs sold Households • Firms Land, Labor, Capital, Entrepreneurs Inputs for production Factor Market Income, Wages, Salaries Payments for the F.O.P
Daily Assignment - Circular Flow Model of Economic Activity Consumer Spending1. _________________________ • Business Income • _________________________ Product Market Goods Purchased 1. ______________________________ 2. _______________________________ Goods Offered1. ___________________________ 2. ___________________________ • Household • ________________________ FirmFirm 1. _____________________________ Firm 2. _____________________________ Inputs for Production 1. ___________________________ Factor of Production Offered1. ___________________________ Factor Market Weekly Income1. __________________ Payments for F.O.P 1. _________________
Circular Flow Model of Economic Activity Consumer Spending1. _________________________ • Business Income • _________________________ 9.49 9.49 Product Market Goods Purchased 1. ______________________________ Goods Offered1. ___________________________ 2. ___________________________ 3.___________________________ Tacos BurritosFajitas Fajitas • Household • ________________________ • ________________________ FirmFirm 1. _____________________________ Firm 2. _____________________________ Elisa Marcella Cilantros Books a Million Input for Production _________________________ _________________________ ________________________ Factor of Production Offered1. ___________________________ Stockers Coffee Sellers Cashiers Labor/Salesperson Factor Market Payments for F.O.P ________________ ________________ ________________ Weekly Income1. __________________ 200 3000- Lease 2200 – Electric 400 - Water
Circular Flow Model of a Mixed Economy Consumer Spending/Investing Business Income/Revenue Product Market Goods and Services Sold Taxes Goods and Services Purchased: Taxes Households Expenditures Expenditures • Firms Land, Labor, Capital, Entrepreneur Inputs for Production (F.O.P.) Taxes Taxes Factor Market Income to Households/Individuals Payment for F.O.P. – Wages, rent, capital goods
Production Possibilities Frontier Model • PPF Model – shows/illustrates the possible combinations of output that can be produced given the productive resources available • Used to visually represent tradeoffs and opportunity cost Good A C B A Good B
Production Possibilities Frontier Activity • Materials for each student: • 8 sheets of 8 1/2 x 11 paper 1 roll tape 1 pair scissors 1 pencil or pen • Conducting the experiment: • For each round, students begin with 16 strips, 16 rectangles, a pen, a roll of tape, and a pair of scissors. • You will have 4 minutes of production time for each round. • Round 1: Make only links (maximum 32). • Round 2: Make only smiles (maximum 32). • Round 3: Make half links and half smiles (16/16)
Reminders • Quick quizzes, Questions for Review and Problems and Application’s due Tuesday night, 1-17 by 9 pm (answers will be posted after 9). • Chapter 2 Test Wednesday, 1-18. • Homework and Youtube videos due on Wednesday, 1-18 included in manilla folder. • Prequiz – Due Thursday, 1-19 at 11:45am
Production Possibilities Frontier ActivityReflection Questions • What resources were scarce? • What was the opportunity cost of producing all smiles? • What was the opportunity cost of producing all links? • How did you increase efficiency? • When did you experience underutilization/inefficiency? • What allowed for growth? • How does this relate to the real world?
Production Possibilities Frontier Model • Individual PPF – Individual tradeoffs • Constant opportunity cost - Linear shape of the curve represents a perfect/proportional tradeoff between two goods Work 1 Hour 30 Min B A C 0 30 Min Play 1 Hour
Production Possibilities Frontier Model • Society’s PPF – social tradeoffs • Shape of the curve is generally bowed outwards • Law of increasing opportunity cost - as production increases, the cost to produce an additional unit of that product increases as well. • Some resources are specialized to only efficiently produce one product so using those specialized resources on a different product is inefficient
30 29 25 10
Production Possibilities Model • What is the PPC Model? • PPC Model – shows/illustrates the possible combinations of goods and services that can be produced by a single nation, firm or individual given the productive resources available • What does it show? • That nothing is free and that everything has an opportunity cost • If society wants more of one thing then it must give up something in return • Used to visually represent opportunity cost
Production Possibilities Model • What basic economic concepts can it be used to model? • Scarcity • Tradeoffs • Opportunity cost • Economic growth • Efficiency • Unemployment Quantity of Computers Produced Production Possibilities Frontier 3,000 2,200 2,000 1,000 F A B E 300 600 700 0 1,000 Quantity of Cars Produced
Production Possibilities Curve • Efficiency – using resources in such a way as to maximize the production of goods and services * • Points along the curve, (a – c) * Efficiency
Underutilization (Inefficiency) • Underutilization – using fewer resources than an economy/business is capable of; inefficient use of resources • Points inside the curve, d (inefficient use of resources) Underutilization/Inefficiency
Growth • Growth (future technology) – the change in ability to produce, reflects a change in the curve; Currently unattainable level of production • New frontier, point e, (usually as a result of new technology) Growth
Basics of the production possibilities frontier model Unattainable/Economic Growth Frontier/Efficiency Underutilization/Inefficiency A B F E C D 1,000
Increase in available resources Decrease in available resources Shifts in the PPF
PPC Activity 12 10 8 6 4 2 Good B 0 1 2 3 4 5 6 Good A • Answer the following questions based on the model above: • The opportunity cost of increasing production from Good A from zero units to one unit is the loss of __________ unit (s) of Good B. • The opportunity cost of increasing production from Good A from one unit to two units is the loss of __________ unit (s) of Good B. The total loss is ____ • The opportunity cost of increasing production from Good A from zero units to 6 units is the loss of _________ unit (s) of Good B.
Review - Guns or Butter PPF • How many guns can be produced when no butter is produced? ________ • How much butter can be produced when no guns are produced? _______ • The opportunity cost of increasing the production of guns from 0 to 40 units is ________ units of butter. • What would it say about this society if the production decision was to produce at the (20, 45) point; assuming that it takes 30 units of butter to provide basic foodstuffs to society and 40 units of Guns to protect their society? ___________________________________________________ This society cares more about military than providing consumer goods for the people
A PPF Exercise 200 B 180 160 140 C 120 100 25 55 60 60 D 80 60 40 20 E 5 10 15 20 25 30 35 40 45 50 55 60 Along the curve (frontier) Inside the curve Outside the curve
PPF Exercise True False True True False
Shoes A 40 35 B 30 25 C 20 15 D 10 5 E CD Players 10 20 30 40 50 60 70
Due Today 8-30 Chapter 1 - 2 • Chapter 1 Notes • Chapter 2 Notes • PPF Practice 1 • PPF Practice 2 • Circular Flow Practice Review Junk!!!
Agenda • Short Answers • Prequiz – Chapter 3 Prequiz A • Due Wednesday – Online Video Quiz “Comparative and Absolute Advantage”
Include on your Test • Name • Date • Class Period • ID: A, B or C • Chapter 2 Test Junk!!!
Extra Credit • Write a positive statement about the benefits of investing in human capital. • Write a normative statement about the government’s role in the economy. • Explain your interpretation of the political cartoon: • Illustrator’s message • Clues (people, symbols etc.) • Do you agree or disagree?