Download
1 / 38
380 likes | 781 Vues
Optical/X-ray continuum regions even smaller (by factors of 10 - 100) ... X-ray data give an important complement to optical: Key X-ray transitions are less ...

E N D
1. Quasars and Gravitational Lensing:A case study in X-ray analysis Tom Aldcroft, CXC/SAO
2. OVERVIEW
Structure and absorption in AGN
Broad Absorption Line (BAL) QSOs
UM425: Characteristics and motivation for Chandra observation
Gravitational Lensing
UM425 data: first look
Spectral analysis
UM425A (high counts)
UM425B (low counts)
Image analysis
Lensing and microlensing in AGN
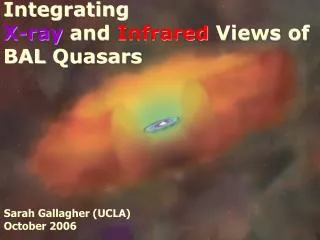
3. Structure of AGN What does a QSO look like?
Jets, bi-conical outflows, dusty torus
Quasars are not spherically symmetric
Direct imaging of central engine of AGN including accretion disk and BELR will require significant technological advances
4. Structure of AGN
Scales for M=108 M?
Black hole 3x1013 cm
Accretion disk 1-30x1014 cm
BLR 2-20x1016 cm
Torus 1017 cm ??
NLR 1018-1020 cm
Jets 1017-1024 cm
This picture based on integrated emission is only part of the story!
5. Absorbing outflows in AGN AGN of all stripes show absorption in optical through X-ray
6. Absorbing outflows in AGN AGN of all stripes show absorption in optical through X-ray
Outflowing material with ejection velocities up to ~0.2c in extreme BALQSOs, but typically narrow with vout ~few 1000 km/s in Seyferts
Absorption presents opportunity for detailed physical analysis along a single sightline (vs. integrated emission)
7. Elvis Structure for Quasars
8. Elvis Structure for Quasars
9. Comparison of Elvis with Urry & Padovani
10. BALQSO in X-rays: UM425 BAL phenomenon � outflowing ionized material � well-characterized in optical but optical lines saturated so determining ionization state difficult
X-ray data give an important complement to optical:
Key X-ray transitions are less saturated over a wide range of column density and ionization
Models predict presence of warm-hot ionizing medium in BAL flows
UM425 was identified in a Chandra survey of 10 bright BALQSOs
Brightest in sample by a factor of two � 46 cts/ksec!
Known to have OVI absorption, indicating high-ionization material
Suspected gravitational lens � another BALQSO (4.5 mags fainter) at same redshift was 6.5 arcsec away. But.. no lensing galaxy known despite efforts
In AO3 we were awarded a 110 ksec ACIS-S observation of UM425
Goals � Best spectrum of a BALQSO, investigate lensing, cluster?
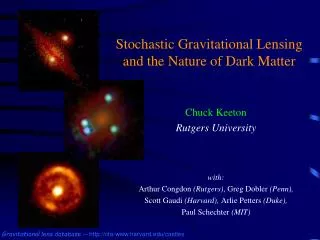
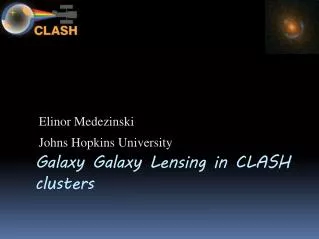
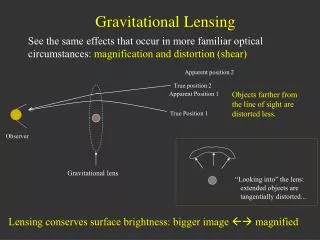
11. Gravitational lensing
12. Gravitational lensing
13. UM425 data: First look
After initial data preparation steps (e.g. http://asc.harvard.edu/ciao/threads/data.html for Chandra data), view the event data in ds9
Make life easier for you and your collaborators by scripting the ds9 commands with the XPA interface1
14. UM425 data: First look � cont'd
Identification of two point sources with UM425A and B can be firmly established by including optical image (WFPC)
15. Low Resolution Spectral Analysis � High Counts First goal: understand the X-ray spectrum of the bright UM425A
With ~5000 counts this is one of the highest S/N X-ray observations of a BALQSO
Science drivers
Is the hard powerlaw typical of other z~1 RQ QSOs?
What is the intrinsic absorbing column?
Is the absorption �warm� or �cold�?
Analysis issues
Source and background extraction regions
Pileup
Fit models
Fit statistics and minimization methods
16. Source and background extraction regions Source extraction region is commonly set to include ~95% of source photons near 1-2 keV
X-ray mirror PSF is broader for hard photons (scattering)
For XMM the analysis tools calculate ARF based on extraction region
For Chandra, standard tools currently do not account for extraction region size
Need to be aware of this effect
1� diameter (on-axis) => ?? ~ 0.10
10� diameter (on-axis) => ?? ~ 0.02
User tools exist to correct ARF1
17. The dreaded pileup issue Multiple photon events within a single or adjacent pixels during a single readout can cause either energy or grade migration
For bright sources this causes distortion in the image and spectrum
An initial estimate of pileup for ACIS can easily be made with PIMMS. For XMM the SAS tool epatplot can be used as a diagnostic.
For moderate pileup in ACIS there is a CIAO thread1 that gives details of how to include the jdpileup model2 in fitting
For strong pileup, the only option may be to excise the core and fit using only the wings. This introduces serious issues related to PSF energy dependence and assumptions in ARF generation.
In the case of UM425A, the pileup fraction was estimated at 6%. Applying the jdpileup model to our fitting produced no statistically significant change in the fit parameters.
18. Common �Off the Shelf� low-resolution models for AGN
19. A different view of X-ray emission
20. AGN spectral features
21. Spectral fitting options Common options for X-ray spectral analysis are XSPEC and Sherpa
As for other analysis tasks, scripting all fits and plot generation will save much time in the long run
Fit statistic (e.g. Chi Gehrels, Chi Primini, Model Variance, Data Variance, Cash, C-stat, etc)
Optimization method (Levenberg-Marquardt, Migrad, Powell, Monte-*, Grid-*)
Binned or unbinned?
22. UM425A spectral fit results
23. UM425A spectral fit results Best fit models (warm absorber and partially-covering neutral absorber) are both acceptable, with no significant residuals
24. UM425A spectral fit results
25. UM425A spectral fit results - Conclusions Apart from the intrinsic absorbing column (NH ~ 3-10 x 1022), UM425 is a very typical z ~ 1.5 radio-quiet QSO
Power law photon index ?=2.0�0.1
Optical to X-ray flux ratio is ??ox=1.6
This argues against the hypothesis that BALQSOs are a special evolutionary state of AGN, e.g. young by analogy with NL Sy-1s
The ionization state of the X-ray obscuring material is not constrained. If neutral then partial covering is required.
26. UM425A spectral fit results - Conclusions No X-ray BAL troughs in UM425A from highly ionized Fe, as seen in APM 08279+5255 (z=3.91) and PG 1115+0801
27. UM425A spectral fit results - Conclusions BALQSOs present a significant observational challenge in X-rays
Most are at moderate to high redshift (z > ~0.5)
Faint � none have been observed with gratings
Interesting spectral region (e.g. OVII) gets shifted into energy range where detector has low effective area and is poorly calibrated. For UM425, OVII is coincident with instrumental Carbon edge (284 eV).
Gravitationally lensed sources are the best prospect (Chartas)
Not burdened with excessive S/N
28. UM425B spectral fitting UM425B has about 29 counts, a factor of ~170 less than UM425A
Optical magnitude difference of 4.5 ? expect a factor of ~60 if lensed
29. Hardness ratios Hardness ratio HR = (H-S)/(H+S) is commonly used as a 1-parameter characterization of spectral shape
S = Soft band counts
H = Hard band counts
Often used in low count situations or surveys with many sources
Advantage: Easy to calculate
Disadvantages:
Uncertainty is hard to calculate in low-counts regime: Fun trick to stump your local statistician! Mortals need to do Monte-Carlo sims
Needs correction factors: Galactic absorption, detector, off-axis angle, time-dependent response
Typically need to convert back to a source model anyway
Ignores any prior information you might have, e.g. thermal or powerlaw spectrum. (Without any prior, HR gives no physical information)
Lower S/N than fitting
30. Hardness ratios
31. Hardness ratios
32. Image analysis UM425 field contains diffuse emission
Consistent with gravitational lensing
Analysis of weak diffuse emission (~200 counts) in presence of strong point source (few thousand counts) is difficult!
33. Image analysis � gettin' fancy Total flux from diffuse emission key to testing gravitational lens theory
34. Image analysis Diffuse emission extends out to ~30 arcsec and has ~180 counts, more than three times the initial lower limit based on the �by-eye excess�
35. Image analysis Cluster emission not centered near UM425B where it would be expected for gravitational lensing
Cluster is not relaxed � perhaps dark matter distribution different from X-ray emitting mass?
36. UM425 � What's the deal? UM425A (bright component) is an otherwise normal QSO which is absorbed (~3-10 x 1022)
We do not know the ionization (warm or neutral?)
If UM425B is a lensed image, the absorption is 5 times higher
Time delay
Different sightline. Scale is interesting
Diffuse emission, offset from both UM425A and B
Flux corresponds cluster with enough mass to create lens splitting
But is there really a cluster there?
YES � Green et al. 2005 found 9 galaxies at z=0.77 in the field
So the problem is solved?
Well... need either unusual lens or unusual galaxy (M/L > 80)
37. Lensing and microlensing in AGN Lensing (macrolensing by foreground galaxies/clusters) offers:
Magnified views (perhaps 50-100 times)
Views of sources at different sightlines1,2
Views at different times
Microlensing by stars in a foreground lensing galaxy acts as a transient magnifying glass
Typical microlensing scale is well-matched to accretion disk size
Chartas et al 2004 detected what appears to be amplification of the Fe-K? emitting region in one of the four cloverleaf images
38. Summary Blah Blah Blah