Download
1 / 22
220 likes | 530 Vues
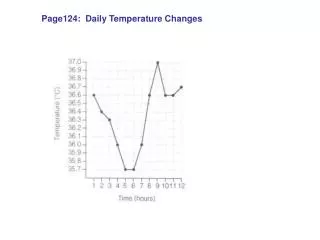
Estimating daily mean temperature. Marie Novak Harry Podschwit Aaron Zimmerman. Questions. If daily temperatures were described by a sine curve, the average daily temperature would indeed be the average of min and max. How well is daily temperature described by a sine curve?

E N D
Estimating daily mean temperature Marie Novak Harry Podschwit Aaron Zimmerman
Questions • If daily temperatures were described by a sine curve, the average daily temperature would indeed be the average of min and max. How well is daily temperature described by a sine curve? • What is the effect on bias and variability of different observational schemes?
The Data • Times and locations • January - Visby Island, Sweden • June - Red Oak, Iowa, USA • Temperature measurements taken every minute • Red Oak data more variable than the January data • Variance(Red Oak) ≈ 6.05°C2 • Variance(Visby Island) ≈ 3.56°C2
The Models • Iceland • Edlundmodel (Sweden) • Ekholmmodel (Sweden) • a,b,c,d and e are specific to the time of year • Min-Max model (U.S. and others)
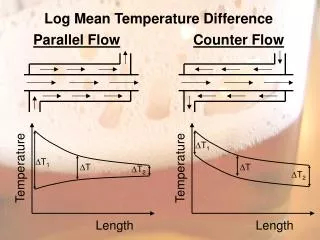
Two-Stage Cosine Model • Fit the sunlight portion of the day with a cosine model • Use NLS: temp = A*cos(2π*B*time + C) + D + error • Add straight line segment between sunset and sunrise • Integrate over the piecewise function and average
Good Fit Bad Fit
Bias and Variability • Model error • Error between different models • Measurement error • Error in observation times • Error in linear combination models • Error in different linear combination schemes
Model Error • Investigated the tendency of 5 different models to over/under-estimate the daily mean temperature • Iceland model • Edlund model • Ekholm model • U.S. model • 2-Stage Cosine model (Aaron’s model)
What Are the Consequences of Errors in Measurement Time? • Recalculate the error of each model for all of the temperature values from the bottom to the top of the hour • How does the error change if you were 1 minute late in taking your measurements? 5 minutes? 59 minutes?
Visby Island, Sweden Red Oak, IA
Observation Error Results Visby Island, Sweden Red Oak, IA
What If You Were Really, Really Bad at Taking Measurements? • Simulated error in observation times by randomly sampling data points within the hour • Simulation repeated 10,000 times and RMSE of daily mean temperature over the month calculated
Visby Island, Sweden Red Oak, IA
Observation Error Results Visby Island, Sweden Red Oak, IA
What Kind of Biases Are Possible From Linear Combinations of Temperature Data? • Performed a Monte Carlo simulation in which the daily mean temperature was calculated with a random linear combination of the temperature data points taken at every hour • Dot product of random weighting and hourly temperature readings
Visby, Sweden Red Oak, IA Pearson correlation coefficient: 0.583 Spearman correlation coefficient: 0.562 Pearson correlation coefficient: 0.373 Spearman correlation coefficient: 0.358
Visby Island, Sweden Red Oak, IA The contingency table of the simulated data.[X2=4330.182, p-value < 2.2 * 10-16] ⱷ=0.208 The contingency table of the simulated data.[X2=13231.4, p-value < 2.2 * 10-16] ⱷ=0.364
Conclusions • For Visby Island, little inter-hour variation • For Red Oak, enough inter-hour variation to make meaningful changes to model given error in measurement times • Linear combinations of temperature data tended to underestimate DMT when more weight was put on temperatures early in the day. Similarly, the models tended to overestimate when more weight was put on temperatures later in the day.
Conclusions • There was no one “best” model • Geographic/seasonal factors • Edlundmodellowest RMSE for Visby Island but not for Red Oak, IA • Iceland model lowest mean error for Visby Island, highly variable • The Ekholm and Min-Max model tended to underestimate for both data sets but not significantly so • For Red Oak data, the 2-stage cosine model tended to underestimate; the Iceland and Edlund models tended to overestimate (although Iceland not significantly) • Implications for worldwide standardized method of measurement?